简体中文
繁體中文
English
Pусский
日本語
ภาษาไทย
Tiếng Việt
Bahasa Indonesia
Español
हिन्दी
Filippiiniläinen
Français
Deutsch
Português
Türkçe
한국어
العربية
What Are Moving Averages and How Do They Work?
Abstract:A moving average is simply a way to smooth out price fluctuations so you can tell the difference between market "noise" and the actual trend direction.
One of the most widely utilized technical indicators is moving averages.
A moving average is simply a way to smooth out price fluctuations so you can tell the difference between market “noise” and the actual trend direction.
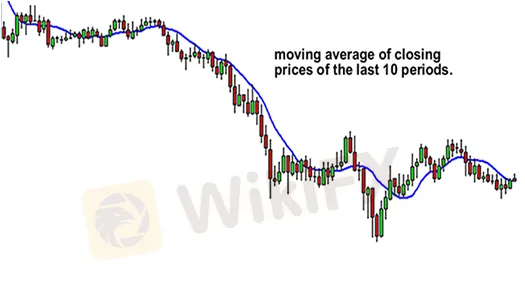
Taking the average closing price of a currency pair over the last 'X' number of periods is referred to as “moving average.”
It would look like this on a graph:

The moving average appears as a squiggly line on top of the price, as you can see (represented by Japanese candlesticks).
A “chart overlay” is a term used to describe this type of technical indication.
On the price chart, the moving average (MA) is overlayed! Do you get it?
A moving average (MA) indicator, like any other technical indicator, is used to forecast future prices.
Why not simply glance at the pricing to see what's going on?
The reason for using a moving average rather than just looking at the price is that, aside from Santa Clause not being real, trends do not move in straight lines in the real world.
Because pricing zigzags and zags, a moving average smooths out the fluctuations and allows you to “see” the underlying trend.

You can better discern the trend direction by looking at the slope of the moving average.
As we indicated, moving averages smooth out price activity.
Moving averages come in a variety of shapes and sizes, each with its own level of “smoothness.”
The smoother the moving average, the slower it reacts to price changes in general.
The faster the moving average reacts to price fluctuation, the choppier it is.
You should get the average closing prices over a longer time period to make a moving average smoother.
How to Choose the Right Moving Average “Length”
The “length,” or number of reporting periods included in the moving average computation, has an impact on how the moving average appears on a price chart.
The fewer data points that are included in the moving average calculation, the closer the moving average keeps to the current price, the shorter its “length.”
This limits its use and may provide less information about the overall trend than the present price.
The longer it is, the more data points are incorporated in the moving average calculation, implying that every single price has a smaller impact on the overall average.
Price fluctuations may become “too smooth” if there are too many data points, and you won't be able to discern any kind of trend!
In any case, determining whether price direction will alter in the near future might be challenging.
As a result, it's critical to choose a length (or periods) that delivers the optimum amount of price data for your trading timeframe.
“Come on, let's get to the fun part,” you're presumably thinking. “How can I put this to use as a trading tool?”
First, we'll go through the two main forms of moving averages in this section:
Simple
Exponential
Well also teach you how to calculate them and give the advantages and cons of each. You must first master the fundamentals, just like you must master the fundamentals in any other wikifx class!
We'll teach you the numerous ways to use moving averages and how to incorporate them into your trading strategy once you've got that down like Argentinian soccer player Lionel Messi's ball-handling skills.

You'll be as silky as Messi's by the conclusion of this session!
Remember that moving averages smooth price data to generate a trend-following technical signal before moving on.
They do not predict price direction; rather, they use a lag to identify the current direction.
Are you all set?
Give us a “Hell yeah!” if you are.
If not, go back and read the introduction again.
Proceed to the next lesson after you're psyched and ready to go.
Disclaimer:
The views in this article only represent the author's personal views, and do not constitute investment advice on this platform. This platform does not guarantee the accuracy, completeness and timeliness of the information in the article, and will not be liable for any loss caused by the use of or reliance on the information in the article.
Read more

Forex is a game that I enjoy playing
These champions have one thing in common: they not only work their butts off, but they also enjoy what they do.

Wait patiently. Maintain your discipline
"Patience is the key to everything," American comic Arnold H. Glasgow once quipped. The chicken is gotten by hatching the egg rather than crushing it."

There isn't a Holy Grail to be found!
Ask any Wall Street quant (the highly nerdy math and physics PhDs who build complicated algorithmic trading techniques) why there isn't a "holy grail" indicator, approach, or system that generates revenues on a regular basis.

Concentrate on the Process. Profits aren't a priority
We've designed the School of WikiFX as simple and enjoyable as possible to help you learn and comprehend the fundamental tools and best practices used by forex traders all over the world, but keep in mind that a tool or strategy is only as good as the person who uses it.
WikiFX Broker
Latest News
What is a Stop Out Level?
Challenges of A-Book Execution
Japanese Candlestick Anatomy
What is the difference between support and resistance?
Candlesticks with Support and Resistance
Dual Candlestick Patterns
Basic Japanese Candlestick Patterns
How to Place Your Stop Using Fibonacci to Lose Less Money
What is the Difference Between Double Tops and Double Bottoms?
Bearish and Bullish Pennants and How to Trade Them
Currency Calculator


