简体中文
繁體中文
English
Pусский
日本語
ภาษาไทย
Tiếng Việt
Bahasa Indonesia
Español
हिन्दी
Filippiiniläinen
Français
Deutsch
Português
Türkçe
한국어
العربية
Bearish and Bullish Pennants and How to Trade Them
Abstract:Pennants, like rectangles, are continuation chart patterns that form following big advances. Buyers and sellers often take a breather after a large upward or negative move before continuing to move the pair in the same direction.
Pennants, like rectangles, are continuation chart patterns that form following big advances.
Buyers and sellers often take a breather after a large upward or negative move before continuing to move the pair in the same direction.
As a result, the price tends to consolidate and form a little symmetrical triangle called a pennant.

More buyers or sellers often opt to jump in on the powerful move while the price is still consolidating, leading the price to break out of the pennant formation.
Pennants that are bearish
During a sharp, almost vertical downtrend, a bearish pennant forms.
Some sellers close their positions after the steep decline in price, while others decide to join the trend, causing the price to consolidate for a while.

When enough sellers enter the market, the price falls below the bottom of the pennant and continues to fall.

As you can see, immediately the price made a breakout to the bottom, the decrease persisted.
We'd place a short order at the bottom of the pennant with a stop loss above the pennant to trade this chart pattern.
That way, if the breakdown was a ruse, we'd be out of the transaction right away.
Unlike other chart patterns, where the size of the next move is roughly equal to the formation's height, pennants designate significantly greater moves.
To determine the size of the breakout move, the height of the previous move (known as the mast) is usually employed.
Pennant Bullish
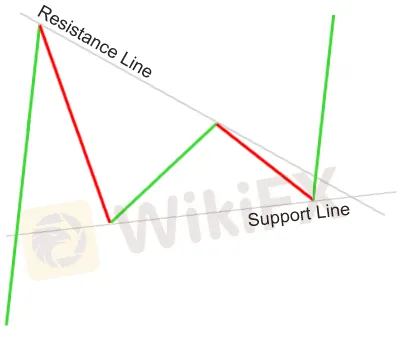
Bullish pennants, as the name implies, designate that bulls are preparing to roar again.
This suggests that after that small time of consolidation, when bulls have gathered enough energy to push the market higher, the steep rise in price will restart.

The price made a sharp vertical increase before taking a pause in this scenario. The bulls are stomping and heating up for another charge!

After the breakout, the price made another important run upwards, just as we predicted.
To avoid fakeouts, we would place our long order above the pennant and our stop order below the bottom of the pennant.
As earlier stated, the size of the breakout move is roughly equal to the mast's height (or the size of the earlier move).
Pennants may be little in size, but they can herald major price changes, so don't dismiss them!
Disclaimer:
The views in this article only represent the author's personal views, and do not constitute investment advice on this platform. This platform does not guarantee the accuracy, completeness and timeliness of the information in the article, and will not be liable for any loss caused by the use of or reliance on the information in the article.
Read more

Forex is a game that I enjoy playing
These champions have one thing in common: they not only work their butts off, but they also enjoy what they do.

Wait patiently. Maintain your discipline
"Patience is the key to everything," American comic Arnold H. Glasgow once quipped. The chicken is gotten by hatching the egg rather than crushing it."

There isn't a Holy Grail to be found!
Ask any Wall Street quant (the highly nerdy math and physics PhDs who build complicated algorithmic trading techniques) why there isn't a "holy grail" indicator, approach, or system that generates revenues on a regular basis.

Concentrate on the Process. Profits aren't a priority
We've designed the School of WikiFX as simple and enjoyable as possible to help you learn and comprehend the fundamental tools and best practices used by forex traders all over the world, but keep in mind that a tool or strategy is only as good as the person who uses it.
WikiFX Broker
Latest News
What is a Stop Out Level?
Challenges of A-Book Execution
Japanese Candlestick Anatomy
What is the difference between support and resistance?
Candlesticks with Support and Resistance
Dual Candlestick Patterns
Basic Japanese Candlestick Patterns
How to Place Your Stop Using Fibonacci to Lose Less Money
What is the Difference Between Double Tops and Double Bottoms?
Bearish and Bullish Pennants and How to Trade Them
Currency Calculator


