简体中文
繁體中文
English
Pусский
日本語
ภาษาไทย
Tiếng Việt
Bahasa Indonesia
Español
हिन्दी
Filippiiniläinen
Français
Deutsch
Português
Türkçe
한국어
العربية
Gold Price Outlook: Technical Support Remains Under Pressure
Abstract:Gold trades either side of an important technical support level and with little in the way of any other drivers, the next move may be to the downside.
Gold Price Analysis, News and Chart.
We have just released our Q2 Trading Forecasts for a range of currencies and commodities including Gold.
Technical support under pressure as buyers sit on the sidelines.
Markets undecided on risk appetite but trade talks turn mildly positive.
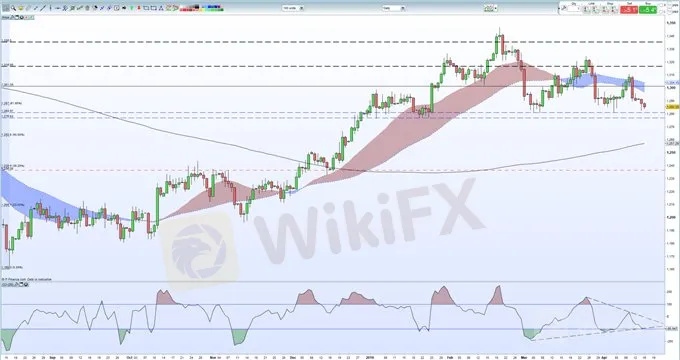
Gold is currently sitting on the important 61.8% Fibonacci retracement level of the April – August 2018 move at $1,287/oz. and may make another attempt at the recent lows. A quiet start to a holiday-shortened week in Europe saw gold fade lower and if gold closes below $1,287/oz. an important zone between $1,281/oz. and $1,276.8/oz. nears. Below here the precious metal will be trading back at levels last seen at the end of December 2018 and the sell-off may gather strength. The chart does show a couple of supportive signs, with gold remaining above the important 200-day moving average, currently at $1,257/oz. while the CCI indicator shows the metal touching oversold conditions.
How to Trade Gold: Top Gold Trading Strategies & Tips.
Gold Price Chart Daily Time Frame (August 2018 – April 8, 2019)

US Treasury yields continue to weigh on gold with the yield on the 10-year UST at, or close to, a one-month high of 2.56%. The yield curve also remains positive with the 3-month/10-year spread at +13 basis points and the 2-year/10-year spread at +16 basis points. US-China trade deal optimism continues to grow after US Treasury Secretary Steven Mnuchin said that talks were progressing well, while US-Japan trade talks are also said to moving in a positive direction.
US Treasury 10-year Yield - April 16, 2019

IG Client Sentiment shows that retail traders are 76.9% net-long of Gold, a bearish contrarian indicator. See how recent changes in positioning affect our trading bias.
Disclaimer:
The views in this article only represent the author's personal views, and do not constitute investment advice on this platform. This platform does not guarantee the accuracy, completeness and timeliness of the information in the article, and will not be liable for any loss caused by the use of or reliance on the information in the article.
Read more

Gold Price Technical Outlook: More Gains on the Cards
The gold price has filled a gap on the daily chart and is now heading higher again, suggesting a continuation of the present uptrend.

Gold Price Outlook: May Opening Range on Radar Following Fed Meeting
Gold retraces the decline following the FOMC meeting, but the broader outlook warns of a shift in market behavior as a head-and-shoulders formation remains in play.
WikiFX Broker
Latest News
Bitcoin in 2025: The Opportunities and Challenges Ahead
BI Apprehends Japanese Scam Leader in Manila
Join the Event & Level Up Your Forex Journey
Is There Still Opportunity as Gold Reaches 4-Week High?
Bitcoin miner\s claim to recover £600m in Newport tip thrown out
Good News Malaysia: Ready for 5% GDP Growth in 2025!
Breaking News! Federal Reserve Slows Down Interest Rate Cuts
Beware: Pig Butchering Scam Targeting Vulnerable Individuals
This Economic Indicator Sparks Speculation of a Japan Rate Hike!
Dutch Law Student Arrested for €4.5 Million Crypto Scam
Currency Calculator


