简体中文
繁體中文
English
Pусский
日本語
ภาษาไทย
Tiếng Việt
Bahasa Indonesia
Español
हिन्दी
Filippiiniläinen
Français
Deutsch
Português
Türkçe
한국어
العربية
Gold Price Technical Outlook: More Gains on the Cards
Abstract:The gold price has filled a gap on the daily chart and is now heading higher again, suggesting a continuation of the present uptrend.
Gold price, news and analysis:
黄金价格,新闻和分析:
The price of gold slipped back Monday, filling a gap on the daily chart.
黄金价格周一回落,填补日线图上的差距。
However, it has hit a new six-year high Tuesday and that could mean further gains are on the way.
然而,它已经在周二触及新的六年高点,这可能意味着进一步上涨。
Gold price technical outlook positive
黄金价格技术展望正面
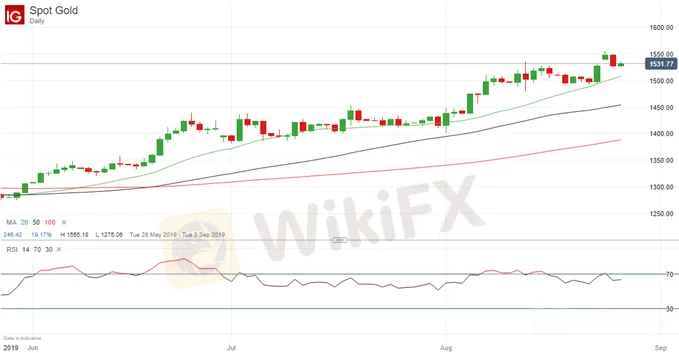
The price of gold fell back Monday, filling a gap on the daily chart (see below). However, it is climbing again Tuesday, reaching a new six-year high and suggesting that the multi-year advance in the price of the precious metal is not yet exhausted.
黄金价格周一回落,填补了日线图上的空白(见下文)。然而,它在周二再次攀升,达到新的六年高位,并暗示贵金属价格多年的上涨尚未用尽。
Currently, the price is above the 20-day moving average, which is above the 50-dma and that in turn is above the 100-dma – suggesting a classic upward trend. Moreover, the 14-day relative strength index, which has flirted with the 70 “overbought” level, is now back below it, adding to the positive chart outlook.
目前,价格高于20日移动平均线,高于50日移动均线,反过来高于100日移动均线 - 表明经典的上升趋势。此外,14日相对强弱指数,已经与70“超买”水平调整,现在回到它之下,增加了正面图表前景。
Gold Price Chart, Daily Timeframe (May 28 – August 7, 2019)
黄金价格走势图,每日时间表(2019年5月28日至8月7日)

Chart by IG (You can click on it for a larger image)
IG图表(您可以点击它查看大图)
Near-term, there is support for the gold price at last Fridays $1,493.61 low and just above that at $1,507.68, where the 20-dma currently kicks in. For resistance, however, it is necessary to look at the weekly chart below.
近期,上周五黄金价格支撑位于1,493.61美元低点,略高于1,507.68美元,目前20日均线位于该位置。但对于阻力位,有必要查看下方的周线图。
Gold Price Chart, Weekly Timeframe (October 8, 2012 – August 7, 2019)
黄金价格走势图,每周时间范围(2012年10月8日 - 2019年8月7日)

Chart by IG (You can click on it for a larger image)
IG图表(您可以单击它以查看大图)
This shows a high of $1,590.40 in the week of April 8, 2013 and, above that, a high of $1,616.83 in the week of March 8, 2013. These, plus the $1,600 “round number” between them can be regarded as the near-term targets. Note, however, that volume was high when the price fell Monday, despite a bank holiday in the UK, and that can be read as a warning against irrational exuberance.
这显示2013年4月8日当周的高点1,590.40美元,高于1美元的高点,2013年3月8日这一周的16.83。这些以及它们之间1,600美元的“整数”可被视为近期目标。但请注意,尽管英国银行假期,但周一价格下跌时成交量仍然很高,这可以被视为对非理性繁荣的警示。
Disclaimer:
The views in this article only represent the author's personal views, and do not constitute investment advice on this platform. This platform does not guarantee the accuracy, completeness and timeliness of the information in the article, and will not be liable for any loss caused by the use of or reliance on the information in the article.
Read more

Gold Price Forecast
Bears waiting to target $1,700.

Gold Price Update
Gold Down, Investors Await Further Inflation Data

Gold Price, Silver Price Jump After Saudi Arabia Oil Field Attacks
Gold and silver turned sharply higher after the weekend‘s drone attacks on Saudi oil fields saw tensions in the area ratchet higher with US President Donald Trump warning Iran that he is ’locked and loaded.

Gold, Crude Oil Prices at Risk if ECB, US CPI Cool Stimulus Hopes
Gold and crude oil prices may be pressured if the ECB underwhelms investors dovish hopes while higher US core inflation cools Fed rate cut expectations.
WikiFX Broker
Latest News
CFI Partners with MI Cape Town, Cricket Team
Doo Financial Expands Reach with Indonesian Regulatory Licenses
Geopolitical Events: What They Are & Their Impact?
Volkswagen agrees deal to avoid Germany plant closures
Webull Canada Expands Options Trading to TFSAs and RRSPs
CySEC Launches Redesigned Website Packed with New Features
WikiEXPO Global Expert Interview: Simone Martin—— Exploring Financial Regulation Change
TradingView Launches Liquidity Analysis Tool DEX Screener
MultiBank Group Wins Big at Traders Fair Hong Kong 2024
WikiFX Review: Is PU Prime a decent broker?
Currency Calculator


