简体中文
繁體中文
English
Pусский
日本語
ภาษาไทย
Tiếng Việt
Bahasa Indonesia
Español
हिन्दी
Filippiiniläinen
Français
Deutsch
Português
Türkçe
한국어
العربية
NZD/USD Price Analysis: Traders await RBA volatility to decipher the code in the market structure
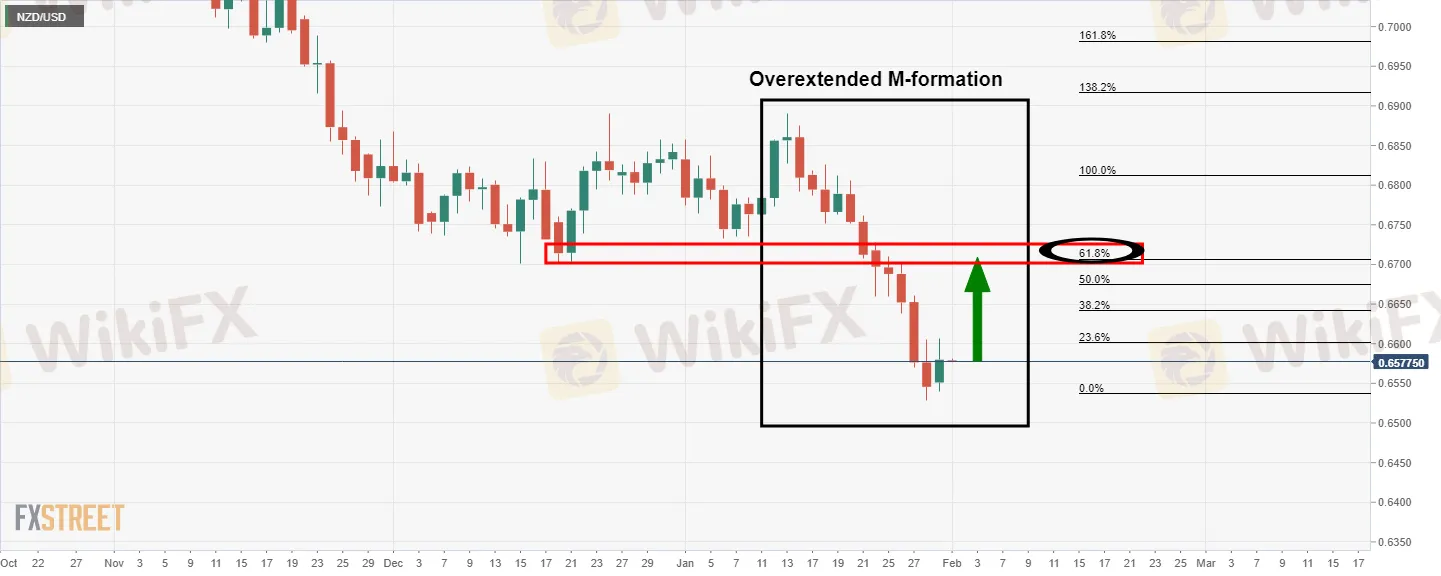
Abstract:The M-formation is overextended, but it is a reversion pattern nevertheless and the price would be expected to correct towards the 61.8% Fibonacci retracement level over the course of the comings days.

NZD/USD traders await key events to take place this week.
The technical outlook is bullish while buyers move in to correct the dominant bearish trend.
It is quite out there in terms of volatility in Asia due to the holidays in the region. However, on a bigger scale, NZD/USD is poised for higher levels in its correction of the daily bearish trend as follows:
NZD/USD daily chart

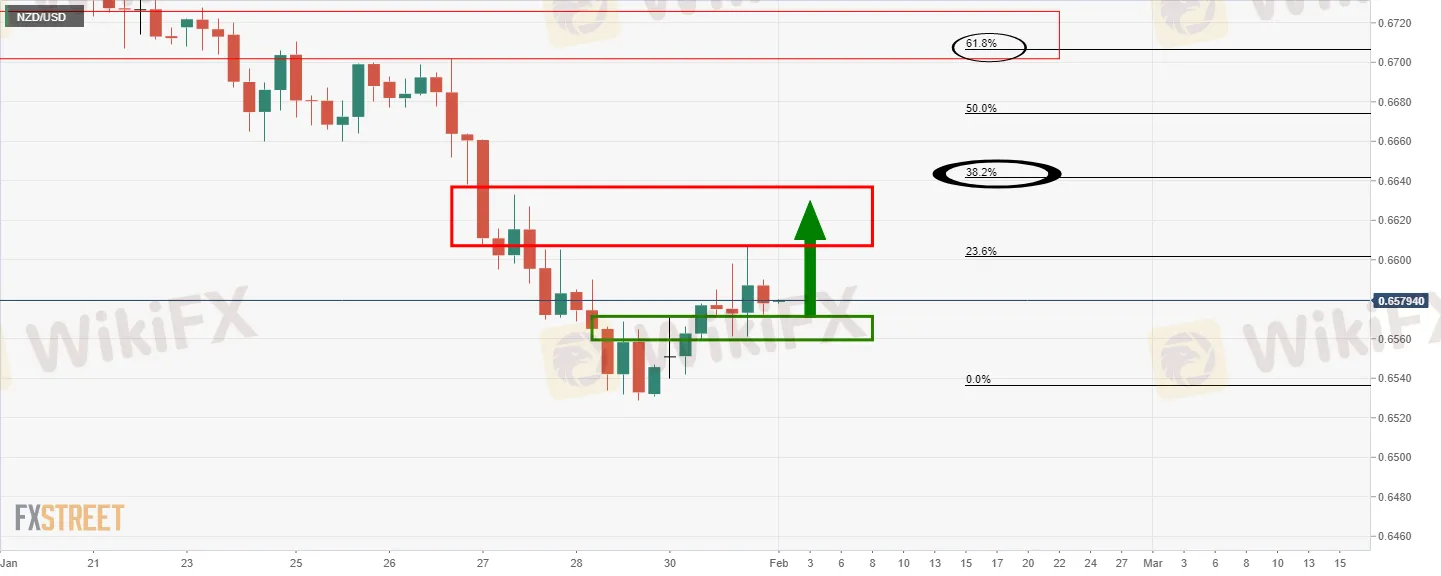
However, given the number of critical events this week, including the Reserve Bank of Australia at the top of the hour, traders would be prudent to allow these to play out (the cause) in order to decipher the code within the market structures subsequent of the price action (the effect).
The RBA could be the catalyst, on a hawkish outcome, to send the kiwi on the coattails of a rally in the Aussie up to test the 38.2% Fibo near 0.6640 for the day ahead. From a 4-hour basis, the structure is ripe for a run to test the resistance on the way there:


Disclaimer:
The views in this article only represent the author's personal views, and do not constitute investment advice on this platform. This platform does not guarantee the accuracy, completeness and timeliness of the information in the article, and will not be liable for any loss caused by the use of or reliance on the information in the article.
Read more

The History of Ponzi Schemes
This article outlines the history of Ponzi schemes, highlighting the infamous Charles Ponzi, Bernie Madoff, and beyond.

5 Key Steps to Master Forex MT4 Technical Analysis
The forex market presents both opportunities and challenges, with technical analysis being crucial for successful trading. This article outlines the five essential steps for mastering Forex MT4 technical analysis: identifying trends, utilizing technical indicators, determining entry and stop-loss points, analyzing price charts, and performing real-time monitoring and adjustments. By following these steps, traders can enhance their understanding and application of technical analysis, ultimately improving their trading accuracy and success rate.

FOREX TODAY: BOC RATE DECISION, UK BUDGET
Wednesday's major data releases and macroeconomic events are expected to cause volatility to increase after another day of erratic trading in the financial markets. The Spring Budget for the UK will be released, and January Retail Sales figures for January will be made available by Eurostat. ADP Employment Change for February and January JOLTS Job Openings will be discussed later in the session on the US economic docket.

FOREX TODAY: AHEAD OF SIGNIFICANT RISK OCCURRENCES, PMI DATA COULD ALERT MARKETS.
Major currency pairings are still trading in familiar ranges early on Tuesday after the erratic trading on Monday. The US economic docket for the American session will include the factory orders data for January and the ISM Services PMI survey for February. Final updates to the February PMI for the US, Germany, the UK, and the EU will also be released by S&P.
WikiFX Broker
Latest News
Revolut X Expands Crypto Exchange Across Europe, Targeting Pro Traders
Broker Review: Is Exnova Legit?
Capital.com Shifts to Regional Leadership as CEO Kypros Zoumidou Steps Down
Crypto Scammer Pleads Guilty in $73 Million “Pig Butchering” Fraud
CWG Markets Got FSCA, South Africa Authorisation
Amazon launches Temu and Shein rival with \crazy low\ prices
CySEC Warns Against Unauthorized Investment Firms in Cyprus
Why Even the Highly Educated Fall Victim to Investment Scams?
Warning Against Globalmarketsbull & Cryptclubmarket
FBI Raids Polymarket CEO’s Home Amid 2024 Election Bet Probe
Currency Calculator


