简体中文
繁體中文
English
Pусский
日本語
ภาษาไทย
Tiếng Việt
Bahasa Indonesia
Español
हिन्दी
Filippiiniläinen
Français
Deutsch
Português
Türkçe
한국어
العربية
USD/CAD regains upside momentum after marking two-day losses.
Abstract:USD/CAD Price Analysis: Crosses 1.2785 resistance to snap two-day downtrend
USD/CAD Price Analysis: Crosses 1.2785 resistance to snap two-day downtrend
USD/CAD regains upside momentum after marking two-day losses.
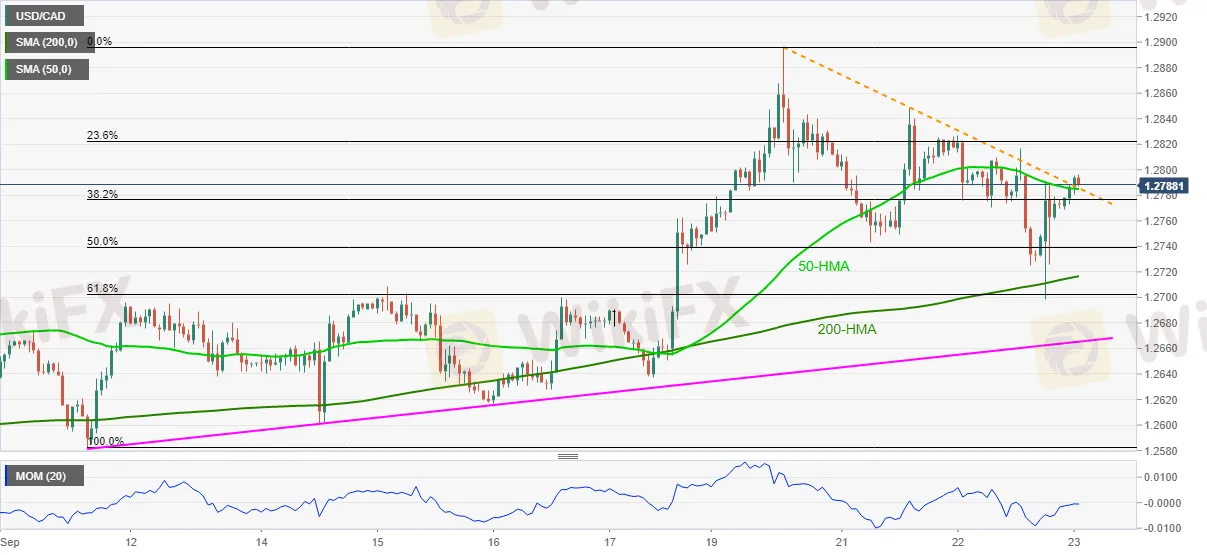
Upside break of 50-HMA, weekly falling trend line joins firmer Momentum line to favor buyers.
200-HMA, 61.8% Fibonacci retracement restrict bears entry before fortnight-old support line.
USD/CAD pierces short-term key hurdle to the north as bulls attack 1.2800 threshold, up 0.14% intraday near 1.2795 during early Thursday.
In addition to a sustained break of 50-HMA and weekly descending trend line breakout, a firmer Momentum line adds to the bullish bias for the USD/CAD.
Hence, 1.2850 is on the cards ahead of the monthly top near 1.2900.
However, any further upside past 1.2900 will not hesitate to challenge the yearly peak of 1.2949.
Alternatively, the resistance-turned-support near 1.2785 restricts immediate downside of the USD/CAD prices ahead of the 200-HMA level surrounding 1.2715.
Also challenging the USD/CAD sellers is 61.8% Fibonacci retracement of September 10-20 upside, as well as a two-week-old horizontal area, respectively near 1.2700 and 1.2695.


Disclaimer:
The views in this article only represent the author's personal views, and do not constitute investment advice on this platform. This platform does not guarantee the accuracy, completeness and timeliness of the information in the article, and will not be liable for any loss caused by the use of or reliance on the information in the article.
WikiFX Broker
Latest News
Volkswagen agrees deal to avoid Germany plant closures
Geopolitical Events: What They Are & Their Impact?
Top 10 Trading Indicators Every Forex Trader Should Know
WikiEXPO Global Expert Interview: Simone Martin—— Exploring Financial Regulation Change
TradingView Launches Liquidity Analysis Tool DEX Screener
MultiBank Group Wins Big at Traders Fair Hong Kong 2024
'Young investors make investment decisions impulsively to keep up with current trends' FCA Reveals
Why Do You Feel Scared During Trade Execution?
CySEC Settles Compliance Case with Fxview Operator Charlgate Ltd
Scope Markets Review: Trustworthy or Risky?
Currency Calculator


