简体中文
繁體中文
English
Pусский
日本語
ภาษาไทย
Tiếng Việt
Bahasa Indonesia
Español
हिन्दी
Filippiiniläinen
Français
Deutsch
Português
Türkçe
한국어
العربية
USD/JPY Forecast Before FOMC Rate Decision
Abstract:These are the updated targets and invalidation levels that matter on the USD/JPY weekly price chart heading into tomorrow’s highly anticipated FOMC rate decision.

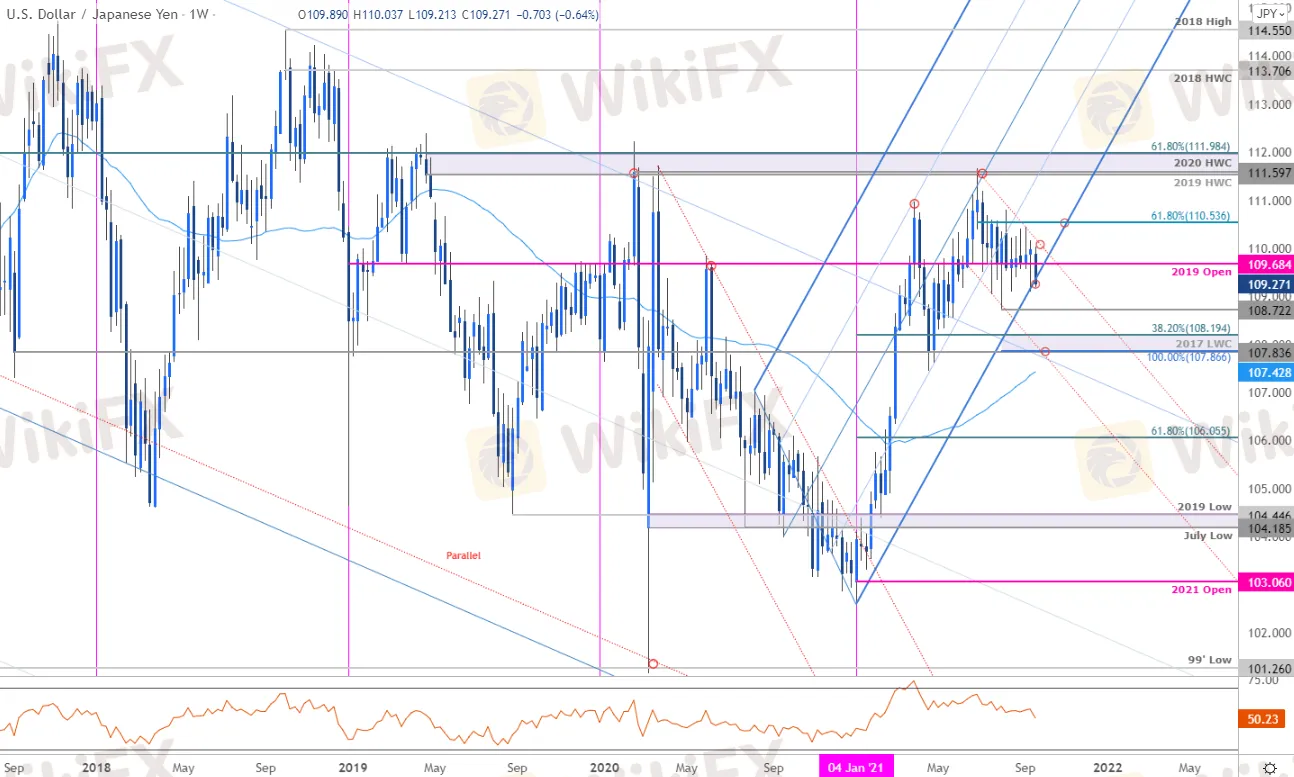
The Japanese Yen rallied more than 0.6% against the US Dollar since the start of the week with USD/JPY plummeting into the range lows at multi-month uptrend support – the battle lines are drawn. These are the updated targets and invalidation levels that matter on the USD/JPY weekly price chart heading into tomorrows highly anticipated FOMC rate decision.
USD/JPY is at uptrend support here (near ~109.07) just ahead of the Fed and the focus is on the weekly close with respect to this trendline. Advances should be capped by channel resistance (currently near ~110) IF price is indeed heading lower with a break exposing the August lows at 108.72 and critical support at 107.86-108.19- a region defined by the 2017 low-week close, the 100% extension and the 38.2% Fibonacci retracement of the yearly range. Ultimately a breach / close above the 61.8% retracement at 110.53 would be needed to mark resumption of the broader uptrend towards 111.60s again.

USD/JPY is now testing the lower bounds of a multi-week price range and were looking for a breakout in the days ahead to offer guidance. From at trading standpoint, a good zone to reduce short-exposure / lower protective stops – look for a reaction / price inflection the yearly upslope with a close below threatening a larger correction towards 108. Stay tuned for the next 24 hours with central bank rate decisions from the Bank of Japan (BoJ) and the Federal Reserve on tap.

Disclaimer:
The views in this article only represent the author's personal views, and do not constitute investment advice on this platform. This platform does not guarantee the accuracy, completeness and timeliness of the information in the article, and will not be liable for any loss caused by the use of or reliance on the information in the article.
Read more

USD/JPY Technical Analysis
USDJPY currency pair rising strongly today – after the pair reversed up from the pivotal support zone lying at the intersection of the key support level 109.65 (which has been repeatedly reversing this currency pair from the end of August, as can be seen from the daily USDJPY chart below), support trendline from April and the 61.8% Fibonacci correction of the previous sharp minor upward impulse wave (i) from the middle of last month.

USD/JPY Technical Outlook
Latest update of USD/JPY.
WikiFX Broker
Latest News
Saxo & Portuguese Bank Partnership
SEC Fines Broker-Dealers $275K for Incomplete SAR Filings
Elon Musk Warns of Imminent US Bankruptcy | Bitcoin Retreats from $100K
WikiEXPO Global Expert Interview: Advanced Practices and Insights in Financial Regulation
Justin Sun Invests $30M in Trump-Backed World Liberty Financial
Kraken Closes NFT Marketplace Amid New Product Focus
Robinhood Launches Ethereum Staking with 100% Rewards Match
Lured by False Promises: Malaysian Driver Lost RM218K to an Investment Scam
FTX Sets March 2025 Timeline for Creditor Payouts: What It Means for Investors
What is an Economic Calendar? How it works
Currency Calculator


