简体中文
繁體中文
English
Pусский
日本語
ภาษาไทย
Tiếng Việt
Bahasa Indonesia
Español
हिन्दी
Filippiiniläinen
Français
Deutsch
Português
Türkçe
한국어
العربية
Crude Oil Prices May Fall as US Data Feeds Growth Slump Fears
Abstract:Crude oil prices may continue to fall alongside stocks if soggy US retail sales and other data continues to feed fears about a looming slump in economic growth.

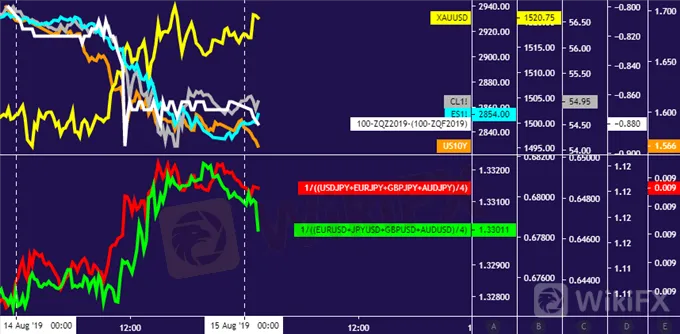
Crude oil, gold price performance chart created using TradingView
CRUDE OIL & GOLD TALKING POINTS:
Crude oil prices drop with stocks on economic slowdown fears
Gold prices rise despite stronger US Dollar as bond yields sink
Soggy US economic data might keep markets on the defensive
Crude oil prices tumbled as worries about slowing economic growth drove broad-based liquidation across global financial markets. The risk-off mood drove a dovish shift in priced-in Fed policy expectations and drove bond yields lower, boosting the relative appeal of non-interest-bearing alternatives.
Not surprisingly, this translated into higher gold prices, even as the US Dollar traded higher in tandem. The metal is typically hurt when a stronger Greenback erodes anti-fiat demand. Appetite for anti-risk assets was apparently so pronounced as to overpower such considerations, sending both upward in tandem.
CRUDE OIL MAY FALL FURTHER AS GOLD GAINS ON US ECONOMIC DATA
A plethora of US economic activity data points are due to cross the wires in the day ahead. Signs of deterioration are expected to appear in the Empire manufacturing survey, the Philadelphia Fed business outlook report, as well as Julys retail sales statistics.
Evidence suggesting that the US economy – a bright spot relative to sluggish performance in other major markets – has started succumbing to global headwinds is likely to bode ill for the markets‘ mood. That hints a repeat of yesterday’s performance might be in the cards.
Get our free guide to help build confidence in your gold and crude oil trading strategy!
GOLD TECHNICAL ANALYSIS
Gold prices managed their way above resistance at 1513.94, the 61.8% Fibonacci expansion, exposing the 76.4% level at 1540.70 next. A daily close above that targets the weekly chart inflection point at 1563.00, followed by the 100% Fib at 1583.96. Alternatively, a turn back below 1513.94 – now recast as support – sets the stage to challenge the 50% expansion at 1492.31 anew.

Gold price chart created using TradingView
CRUDE OIL TECHNICAL ANALYSIS
Crude oil prices recoiled form resistance a falling trend line guiding them lower since late May. From here, a daily close back below the outer layer of support at 54.72 targets the 49.41-50.60 area. Alternatively, a push above the trend line – now at 58.63 – aims for the 60.04-84 zone thereafter.

Crude oil price chart created using TradingView
Disclaimer:
The views in this article only represent the author's personal views, and do not constitute investment advice on this platform. This platform does not guarantee the accuracy, completeness and timeliness of the information in the article, and will not be liable for any loss caused by the use of or reliance on the information in the article.
Read more

Weekly Analysis: XAU/USD Gold Insights
Gold prices have been highly volatile, trading near record highs due to various economic and geopolitical factors. Last week's weak US employment data, with only 114,000 jobs added and an unexpected rise in the unemployment rate to 4.3%, has increased the likelihood of the Federal Reserve implementing rate cuts, boosting gold's appeal. Tensions in the Middle East further support gold as a safe-haven asset. Technical analysis suggests that gold prices might break above $2,477, potentially reachin

KVB Today's Analysis: USD/JPY Eyes Volatility Ahead of BoJ Policy Meeting and US Data
The USD/JPY pair rises to 154.35 during the Asian session as the Yen strengthens against the Dollar for the fourth consecutive session, nearing a 12-week high. This is due to traders unwinding carry trades ahead of the Bank of Japan's expected rate hike and bond purchase tapering. Recent strong US PMI data supports the Federal Reserve's restrictive policy. Investors await US GDP and PCE inflation data, indicating potential volatility ahead of key central bank events.

Today's analysis: USDJPY Poised for Increase Amid Bank of Japan's Strategy
The USD/JPY is expected to rise. The Bank of Japan will keep interest rates between 0 and 0.1% and continue its bond purchase plan but may reduce purchases and raise rates in July based on economic data. Technically, the pair is trending upward with resistance at $158.25 and $158.44, and support at $157.00, $156.16, and $155.93.

USDJPY Predicted to Rise on Yen Depreciation
The USD/JPY pair is predicted to increase based on both fundamental and technical analyses. Fundamental factors include a potential easing of aggressive bond buying by the Bank of Japan (BoJ), which could lead to yen depreciation. Technical indicators suggest a continuing uptrend, with the possibility of a correction once the price reaches the 157.7 to 160 range.
WikiFX Broker
Latest News
CFI Partners with MI Cape Town, Cricket Team
Doo Financial Expands Reach with Indonesian Regulatory Licenses
Volkswagen agrees deal to avoid Germany plant closures
Geopolitical Events: What They Are & Their Impact?
Webull Canada Expands Options Trading to TFSAs and RRSPs
CySEC Launches Redesigned Website Packed with New Features
WikiFX Review: Is PU Prime a decent broker?
TradingView Launches Liquidity Analysis Tool DEX Screener
MultiBank Group Wins Big at Traders Fair Hong Kong 2024
WikiEXPO Global Expert Interview: Simone Martin—— Exploring Financial Regulation Change
Currency Calculator


