简体中文
繁體中文
English
Pусский
日本語
ภาษาไทย
Tiếng Việt
Bahasa Indonesia
Español
हिन्दी
Filippiiniläinen
Français
Deutsch
Português
Türkçe
한국어
العربية
Crude Oil Prices Snap Back to 55 After Sellers Thwarted at Support
Abstract:WTI crude oil prices caught a reprieve after running into support last week around the June lows. But will buyers be able to constrain a third test?
WTI Crude Oil Talking Points:
WTI原油谈话要点:
WTI crude oil prices have put in a vigorous bounce after last weeks re-test of support around the June lows.
WTI原油价格出现剧烈反弹在经过最后几周重新测试六月低点附近的支撑后。
Price action has already jumped back to the 55-handle, which is an area of prior support-turned-resistance, which can keep the door open for bearish swing strategies.
价格行动已经跳回55手柄,这是一个领域先前的支撑转向阻力,可以保持大门看跌摆动策略。
The big picture item of interest in wti is the 42.40 level that currently sits as the three-year-low; which could function as near-term targets for short-term breakout strategies. And if that level comes into play, something much larger might be afoot.
wti感兴趣的大图是42.40水平目前处于三年低位;这可以作为短期突破策略的近期目标。如果这个级别发挥作用,可能会发生更大的事情。
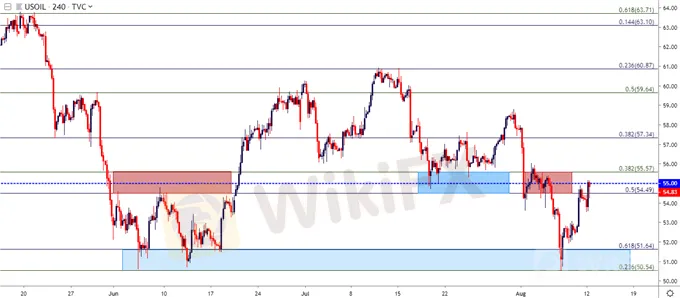
Its been turn-around type of price action over the past few trading days in crude oil. As looked at last week, bears were back in-charge of near-term price action, pushing prices in WTI all the way down for a visit of the support range that came into play around the June lows. This zone is comprised of two Fibonacci levels at 50.54 and 51.64; with the latter of those prices coming into play last Wednesday ahead of a vigorous bounce. This is technically below the June swing, which bottomed out just a few cents higher on the chart, and this a fresh seven-month-low.
它的转向类型过去几个交易日原油价格走势。正如上周看到的那样,空头回归了近期的价格行动,推动WTI的价格一路走低,以寻求6月低点附近的支撑区间。该区域由两个斐波那契水平组成,分别为50.54和51.64;这些价格的后者在上周三发生剧烈反弹之后开始发挥作用。这在技术上低于6月份的涨幅,在图表上仅下跌了几美分,这是一个新的7个月低点。
WTI Crude Oil Four-Hour Price Chart
WTI原油四小时价格图表

Chart prepared by James Stanley; Oil on Tradingview
图表由James Stanley编写;交易时的油价
{11} 图表由James Stanley编写;交易时的油价 {11}
The three-day-bounce in crude oil prices has pushed right back up to another area of interest around the 55-handle. This zone had helped to cauterize support in mid-July; soon becoming resistance earlier this month as prices had started to fall with vigor. A hold of resistance here keeps the door open for bearish plays in WTI, looking for short-side swings targeting a re-test of the June support zone that recently came into play. Along the way, nearer target potential exists around 53.25 and 52.50, each of which can be used for break-even stop moves while seeking out that larger bearish move down towards the 50-handle.
原油价格连续三天的反弹推动了55手柄附近的另一个利益区域。这个区域在7月中旬帮助烧结了支持;由于价格开始迅速下跌,本月早些时候很快成为阻力。阻力位在WTI开启看空情绪,寻找短线波动,重新测试最近发挥作用的6月支撑区。一路上,更接近目标p最终存在于53.25和52.50附近,每个都可用于收支平衡止损,同时寻找更大的看跌向下移动至50手柄。
WTI Crude Oil Eight-Hour Price Chart
WTI原油八-Hour Price Chart

Chart prepared by James Stanley; Oil on Tradingview
Crude Oil Long-Term
原油长期
The primary point of attraction here for short-side plays wouldnt be looking for just another revisit to support; but, rather, for the third test of this very key zone on the chart to open the door for a deeper downside break. And given the current fundamental environment in which global growth remains in drawdown, and cheaper crude prices could very much come into play even as risk markets are pressing back towards all-time-highs.
这里短线游戏的主要吸引力不会仅仅是寻找另一个重访支持;但是,相反,对于图表上这个非常关键区域的第三次测试,为更深层次的下行突破打开了大门。考虑到当前全球增长仍处于缩减的基本环境,即使风险市场正在回到历史最高点,原油价格也会更加便宜。
On a longer-term, bigger-picture basis, the level of 42.40 continues to stand out with interest. This is the current three-year-low in wti crude oil and its already turned-in multiple support inflections. But, similar to the shorter-term scenario looked at above, the allure is in the potential for a breakdown as a push below this level could see crude prices trading back in the 30s before too long. Nonetheless, that scenario remains a bit distant and, for now, the 42.40 level is of interest for near-term breaks below the 50-handle.
从更长期,更大的角度来看,42.40的水平继续引人注目。这是目前WTI原油三年来的低位以及已经上涨的多种支撑位。但是,类似于上面所看到的短期情景,这种吸引力有可能导致崩溃,因为低于这一水平的推动可能会看到原油价格在30多年前回落太久。尽管如此,这种情况仍然有点遥远,目前,42.40的水平对于低于50手柄的近期突破感兴趣。
WTI Crude Oil Weekly Price Chart
WTI原油每周价格走势图

Chart prepared by James Stanley; Oil on Tradingview
James Stanley编制的图表;交易查看石油
Disclaimer:
The views in this article only represent the author's personal views, and do not constitute investment advice on this platform. This platform does not guarantee the accuracy, completeness and timeliness of the information in the article, and will not be liable for any loss caused by the use of or reliance on the information in the article.
Read more

Oil Price Technical Analysis: WTI to 55 - Can Sellers Take Control?
Oil prices were back on offer yesterday after a confluent level of resistance came into play. But can sellers continue to push down to big-picture support?

Oil Price Outlook: WTI Crude Oil Price Action Builds Bear Flag
Crude oil prices have crossed back-below the 60-handle, and a short-term bear flag formation has built. Are oil markets on the cusp of another bearish run?

WTI Crude Oil Price Outlook: Pullback to Support, Can Bulls Hold?
Crude oil prices caught a boost this week as production constraints showed around a brewing storm in the Gulf of Mexico, set to touch down this weekend.

Crude Oil Price Congests After 60 Support, Can Bears Make a Mark?
Crude Oil prices have calmed after a rally of more than 50% from the lows. The bigger question is whether this is a pullback or the start of a reversal.
WikiFX Broker
Latest News
ASIC Sues Binance Australia Derivatives for Misclassifying Retail Clients
WikiFX Review: Is FxPro Reliable?
Malaysian-Thai Fraud Syndicate Dismantled, Millions in Losses Reported
Trading frauds topped the list of scams in India- Report Reveals
AIMS Broker Review
The Hidden Checklist: Five Unconventional Steps to Vet Your Broker
Russia to Fully Ban Crypto Mining in 10 Regions Starting January 1, 2025
YAMARKETS' Jingle Bells Christmas Offer!
Why is there so much exposure against PrimeX Capital?
Doo Financial Expands Regulatory Reach with Offshore Licenses in BVI and Cayman Islands
Currency Calculator


