简体中文
繁體中文
English
Pусский
日本語
ภาษาไทย
Tiếng Việt
Bahasa Indonesia
Español
हिन्दी
Filippiiniläinen
Français
Deutsch
Português
Türkçe
한국어
العربية
Copper Price Forecast: Sellers Eye a Test of Multi-Week Low
Abstract:The levels Copper's sellers may need to consider to kick start a downtrend
Copper Price Forecast
铜价预测
Copper chart and analysis.
铜图和分析。
Coppers price action.
Coppers价格行动。
Copper Price – Correcting Lower
铜价 - 修正下方
{6}
Last week Coppers uptrend corrected lowerand created on Thursday a lower high at $6,053, highlighting the possibility of the sellers could be preparing to lead the price.
{6}
The Relative Strength Index (RSI) dropped last week from 60 to 50 and remained flat after. A cross below 50 would be a sign for a possible start of a downtrend momentum.
上周相对强弱指数(RSI)从60降至50,之后持平。低于50的交叉点将表明可能出现下行趋势。
{9}
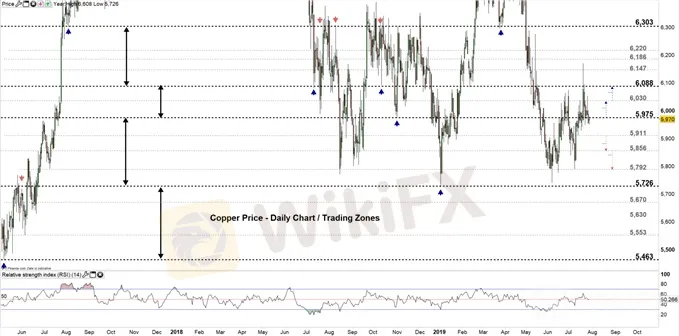
Copper DAILY PRICE CHART (May 15, 2017 – JUly 29, 2019) Zoomed out
铜每日价格表(2017年5月15日 - 2019年7月29日)缩小

Copper DAILY PRICE CHART (May 6 – JULY 29, 2019) Zoomed In
Copper DAILY价格表(2019年5月6日 - 7月29日)放大

Looking at the daily chart we notice on Friday Copper slipped to the lower trading zone $5,911 - $5,975. Hence, the metal currently eyes a test of the low end of this zone, contingent on remaining below the high end. Further close below the low end of this zone could send the price towards $5,856. Although, the weekly support level underlined on the chart (zoomed in) needs to be considered.
查看我们周五公布的日线图铜价跌至较低水平交易区$ 5,911 - $ 5,975。因此,金属目前正在考虑该区域的低端,依赖于保持在高端以下。进一步收盘低于该区域的低端可能会导致价格达到5,856美元。虽然,需要考虑图表上的下划线(放大)的每周支持水平。
On the flip-side, a close above the high end means a return to the old trading zone and opens the door to rally towards $6,030. However, the daily resistance underscored on the chart (zoomed in) Should be watched closely. See the chart to know more about the higher trading zone in a further bullish scenario.
在另一方面,收盘高于高端意味着回归旧的交易区并打开大涨至6,030美元的大门。但是,图表上突出的每日阻力(放大)应该密切关注。请参阅图表以了解更多关于较高交易区域的进一步看涨情景。
CoPper Four-HOUR PRICE CHART (JuLY 9 - JULy 29, 2019)
CoPper四小时价格表(7月9日 - 2019年7月29日)

Looking at the four-hour chart, we notice on Friday Copper closed below the head and shoulders sloping to the upside, since then the price remained below this level. If Copper continues trading below $5,971 this suggests the price may be on its way for a test of the July 9 low at $5,792.
查看四小时图表,我们注意到周五铜价收盘低于头部和肩部向上倾斜,从那时起价格仍然低于这个水平。如果铜继续低于5,971美元交易,这表明价格可能正在测试7月9日的低点5,792美元。
Meanwhile, a break below the July 17 low $5,928 could press the price towards $5,879 contingent on clearing the low end of the aforementioned trading zone (see the chart).
同时,跌破7月17日低位5,928美元可能在清算上述交易区的低端时,将价格推向5,879美元(见图表)。
On the other hand, a break above $6,008 may push the price towards the high end of the right shoulder. Although, the weekly level marked on the chart should be kept in focus. See the chart to know more about the next key resistance levels if the rally continues above the right shoulder.
另一方面,突破6,008美元可能推动价格走向右肩的高端。虽然,图表上标明的每周水平应该保持关注。如果反弹继续在右肩上方,请参见图表以了解更多有关下一个关键阻力位的信息。
Written By: Mahmoud Alkudsi
撰文:Mahmoud Alkudsi
Disclaimer:
The views in this article only represent the author's personal views, and do not constitute investment advice on this platform. This platform does not guarantee the accuracy, completeness and timeliness of the information in the article, and will not be liable for any loss caused by the use of or reliance on the information in the article.
WikiFX Broker
Latest News
Ghana Trader Jailed for $300K Forex and Crypto Scam
US Dollar Surge Dominates Forex Market
Hong Kong Police Bust Deepfake Crypto Scam Syndicate Involving $34 Million
Is it a good time to buy Korean Won with the current depreciation?
Pepperstone Sponsored the "Aston Martin Aramco Formula One Team"
ACY Securities Integrates MetaTrader 5 to Enhnace Copy Trading Service
Malaysian Pilot Loses RM1.36 Million in UVKXE Investment App Scam
Soegee Futures Review: Should You Trust This Broker?
Indonesia officially joins the BRICS countries
Inflation Rebounds: ECB's Big Rate Cut Now Unlikely
Currency Calculator


