简体中文
繁體中文
English
Pусский
日本語
ภาษาไทย
Tiếng Việt
Bahasa Indonesia
Español
हिन्दी
Filippiiniläinen
Français
Deutsch
Português
Türkçe
한국어
العربية
GBPUSD Crumbles as The US Dollar Continues its Pre-FOMC Run
Abstract:GBPUSD now back at lows last seen over 27 months ago driven by a combination of Brexit fears and a rampant US dollar.
Sterling (GBP) Price, Chart and Analysis:
US dollar rallies into the FOMC meeting.
GBPUSD chart breaks down.
Q3 2019 GBP Forecast andTop Trading Opportunities
GBPUSD Back at March 2017 Lows as US Dollar Rallies
The great US dollar rally continues with the greenback approaching a fresh two-year+ high, despite markets fully expecting a 25-basis point interest rate cut at Wednesday‘s FOMC meeting. The US dollar continues to benefit from both the Euro and Sterling’s struggles, and the likelihood is that both will continue to slip lower. The German bond market continues to highlight the weakness in the Euro with yields now negative out to 20-years while the 30-year long bond offers just 19 basis points. The ECB is fully expected to cut rates at its September meeting and will likely re-start QE this year.
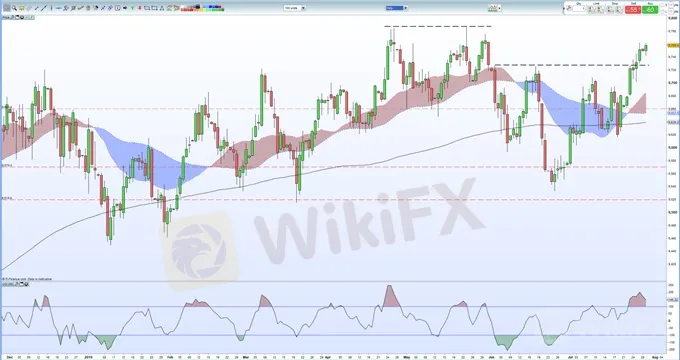
US Dollar Basket (December 2018 - July 29, 2019)

Sterling remains weak and is trading at a 2-year+ low against the SU dollar as the UK ratchets up expectations of leaving the EU with or without a deal on October 31. The British Pound may also underperform with this week‘s Bank of England ’Super Thursday expected to show a more dovish twist, further undermining GBP.
GBPUSD broke out of the symmetrical triangle we wrote about last week and may see further losses in the short-term. The technical set-up remains weak although the CCI indicator is at extreme levels (oversold) on the daily chart and this may temper the move lower. On a weekly chart there are two old higher lows at 1.2109 and 1.1983 before the October 2016 spike-low at 1.1800, all of which may tempt Sterling bears.
Keep up to date with all key economic data and event releases via the DailyFX Economic Calendar
GBPUSD Daily Price Chart (December 2018 – July 29, 2019)

Retail traders are 82.0% net-long GBPUSD according to the latest IG Client Sentiment Data, a bearish contrarian indicator. However recent daily and weekly positional changes give us a stronger bearish contrarian GBPUSD trading bias.
GBPUSD Weekly Price Chart (February 2016 – July 29, 2019)

Disclaimer:
The views in this article only represent the author's personal views, and do not constitute investment advice on this platform. This platform does not guarantee the accuracy, completeness and timeliness of the information in the article, and will not be liable for any loss caused by the use of or reliance on the information in the article.
Read more

GBP/USD (CABLE) 4Hour Anticipation
Daily wise bearish structure, but as 4H shown shift in structure to the topside

Gold Price, Silver Price Jump After Saudi Arabia Oil Field Attacks
Gold and silver turned sharply higher after the weekend‘s drone attacks on Saudi oil fields saw tensions in the area ratchet higher with US President Donald Trump warning Iran that he is ’locked and loaded.

EURUSD Fails to Test 2019 Low, RSI Flashes Bullish Signal After ECB
EURUSD fails to test the 2019-low (1.0926) following the ECB meeting, with the Relative Strength Index (RSI) breaking out of the bearish formation carried over from June.

USDCAD Rebound to Benefit from Sticky US Consumer Price Index (CPI)
Updates to the US Consumer Price Index (CPI) may keep USDCAD afloat as the figures are anticipated to highlight sticky inflation.
WikiFX Broker
Latest News
Geopolitical Events: What They Are & Their Impact?
Volkswagen agrees deal to avoid Germany plant closures
Top 10 Trading Indicators Every Forex Trader Should Know
WikiEXPO Global Expert Interview: Simone Martin—— Exploring Financial Regulation Change
TradingView Launches Liquidity Analysis Tool DEX Screener
MultiBank Group Wins Big at Traders Fair Hong Kong 2024
'Young investors make investment decisions impulsively to keep up with current trends' FCA Reveals
Why Do You Feel Scared During Trade Execution?
CySEC Settles Compliance Case with Fxview Operator Charlgate Ltd
Malaysian Influencer Detained in Taiwan Over Alleged Role in Fraud Scheme
Currency Calculator


