简体中文
繁體中文
English
Pусский
日本語
ภาษาไทย
Tiếng Việt
Bahasa Indonesia
Español
हिन्दी
Filippiiniläinen
Français
Deutsch
Português
Türkçe
한국어
العربية
US Dollar Rise Sinks Crude Oil, Gold Prices - Bank Earnings Due
Abstract:Crude oil and gold prices fell as the US Dollar rallied in the wake of March FOMC meeting minutes. First-quarter earnings reports from US banks are now in focus.
CRUDE OIL & GOLD TALKING POINTS:
US Dollar rise after FOMC minutes hurt gold and crude oil prices
First-quarter earnings reports form US banks now in the spotlight
Oil may fall as gold eyes rates vs USD divergencein risk-off trade
Commodity prices fell yesterday, pressured by a parallel rise in Treasury bond yields and the US Dollar. The benchmark currency gathered upward momentum having bottomed alongside front-end lending rates as March FOMC meeting minutes crossed the wires late Wednesday.
That would prove to set the tone for Thursdays session. Risk appetite soured at the prospect of higher borrowing costs, leading sentiment-geared crude oil prices downward. Gold prices suffered too, weighed down by the diminished appeal of anti-fiat and non-interest-bearing assets.
CRUDE OIL, GOLD LOOK TO US BANK EARNINGS FOR DIRECTION
Looking ahead, the corporate earnings reporting season is in focus. First-quarter reports from banking giants JPMorgan and Wells Fargo take top billing Friday. Traders are probably at least as keen for forward guidance amid slowing global growth as they are for headline results.
A downbeat tone is likely to sour sentiment, pressuring crude oil lower alongside the spectrum of cycle-sensitive assets. As ever, the response from gold is likely to reflect the relative magnitude of subsequent moves in yields and the US Dollar. They tend to diverge in risk-off trade.
See the latest gold and crude oil forecasts to learn what will drive prices in the second quarter!
{10}
GOLD TECHNICAL ANALYSIS
{10}
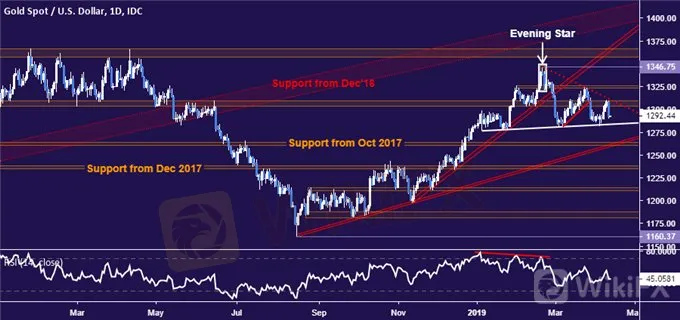
Gold prices recoiled from a confluence of resistance in the 1303.70-09.12 area, marked by a chart inflection zone and a falling trend line set from late February. This puts neckline support at 1281.54 back in focus, with a daily close below that confirming the formation of a Head and Shoulders (H&S) top. The next layer of trend support is at 1258.57, but the H&S formation would imply a larger descent toward $1200/oz ahead.
{12}

CRUDE OIL TECHNICAL ANALYSIS
{12}
Crude oil prices pulled back from support-turned-resistance in the 63.59-64.88 area, but the near-term uptrend set from late December is still in place. A break below 60.39 would invalidate the rise, exposing the 57.24-88 area next. Alternatively, a push above resistance would be immediately met with another barrier in the 66.09-67.03infection zone. Beyond that, the focus turns to the $70/bbl figure.

COMMODITY TRADING RESOURCES
See our guide to learn about the long-term forces driving crude oil prices
Having trouble with your strategy? Heres the #1 mistake that traders make
Join a Trading Q&A webinar to answer your commodity market questions
{18}
--- Written by Ilya Spivak, Currency Strategist for DailyFX.com
{18}
To contact Ilya, use the comments section below or @IlyaSpivak on Twitter
Disclaimer:
The views in this article only represent the author's personal views, and do not constitute investment advice on this platform. This platform does not guarantee the accuracy, completeness and timeliness of the information in the article, and will not be liable for any loss caused by the use of or reliance on the information in the article.
Read more

Weekly Analysis: XAU/USD Gold Insights
Gold prices have been highly volatile, trading near record highs due to various economic and geopolitical factors. Last week's weak US employment data, with only 114,000 jobs added and an unexpected rise in the unemployment rate to 4.3%, has increased the likelihood of the Federal Reserve implementing rate cuts, boosting gold's appeal. Tensions in the Middle East further support gold as a safe-haven asset. Technical analysis suggests that gold prices might break above $2,477, potentially reachin

USDJPY Predicted to Rise on Yen Depreciation
The USD/JPY pair is predicted to increase based on both fundamental and technical analyses. Fundamental factors include a potential easing of aggressive bond buying by the Bank of Japan (BoJ), which could lead to yen depreciation. Technical indicators suggest a continuing uptrend, with the possibility of a correction once the price reaches the 157.7 to 160 range.

Stocks Dip, Bitcoin Surges, Euro Weakens | Daily Market Update
Tech Stocks Under Pressure, Inflation Data Looms

Beginner Tips for Gold Technical Analysis - Forex4you
Are you interested in trading gold? Forex4you will provide you 6 tips for gold technical analysis, which each beginner or novice should know.
WikiFX Broker
Latest News
SQUARED FINANCIAL: Your Friend or Foe?
Big News! UK 30-Year Bond Yields Soar to 25-Year High!
High-Potential Investments: Top 10 Stocks to Watch in 2025
Why Is Nvidia Making Headlines Everywhere Today?
Discover How Your Trading Personality Shapes Success
US Dollar Insights: Key FX Trends You Need to Know
FINRA Charges UBS $1.1 Million for a Decade of False Trade Confirmations
BI Apprehends Japanese Scam Leader in Manila
Bitcoin in 2025: The Opportunities and Challenges Ahead
Join the Event & Level Up Your Forex Journey
Currency Calculator


