简体中文
繁體中文
English
Pусский
日本語
ภาษาไทย
Tiếng Việt
Bahasa Indonesia
Español
हिन्दी
Filippiiniläinen
Français
Deutsch
Português
Türkçe
한국어
العربية
Brexit Vote May Cause Significant Volatility in SEK, NOK - Foggy Outlook
Abstract:USD/SEK and USD/NOK retreated and re-entered familiar trading ranges after reaching multi-year highs. The technical outlook may be complicated by volatility from the upcoming Brexit
NOK, SEK TALKING POINTS – WEEKLY TECHNICAL FORECAST
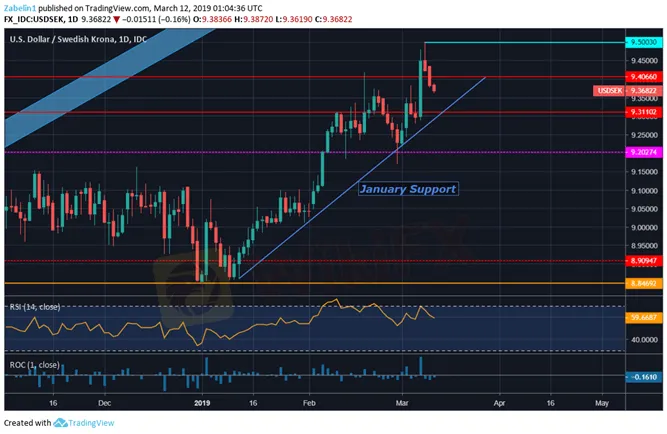
USD/SEK re-entered 9.3110-9.4066 range
Is USD/NOK flirting with 8.6323 support?
Brexit vote volatility makes outlook foggy
See our free guide to learn how to use economic news in your trading strategy!
USD/SEK TECHNICAL ANALYSI
After closing above a 17-year high at 9.4494 with the fingertips at 9.5003, USD/SEK subsequently had some pullback and re-entered a trading range between 9.3110-9.4066. The frequently-tested January support might provide an ample foundation for the pair to continue its climb for the rest of the week. Looking ahead, the pair may struggle to continue along the steep incline above the upper lip of the range.
USD/SEK – Daily Chart
Zooming out to a weekly chart, the pair appear to be resuming what looks like a broad uptrend starting in January 2018. Between August 2018 and January 2019, the pair traded sideways between the 8.9094-9.2027 boundary before it resumed its steep incline.
USD/SEK Weekly Chart
USD/NOK TECHNICAL ANALYSI
USD/NOK also had a meteoric rise with the height at 8.8197 and a close at 8.7995, the highest since December 2018. Around that same time, a resistance range appeared to have been formed between 8.7881-8.8244. The pair attempted to breach the lower bound on several occasions and repeated effort left the pair exhausted and caused it to decline.
This also appears to have been another attempt for the pair to test the January resistance. After the last failure in February, traders may have simply thrown in the towel right around the same time the pair failed to close above 8.7881.
USD/NOK – Four-Hour Chart
A weekly chart reveals how the pair broke a steep trading channel in December and traded lower for a while. However, now the pair appear to be attempting to regroup and continue the charge upward. The boundary between 8.6323-8.7881 may keep the pair in check for the next few months.
USD/NOK – Weekly Chart
Looking ahead, later today the UK Parliament will be voting on the Prime Ministers Brexit deal. Preliminary reports and commentary from her Deputy, David Lidington, indicate the deal may pass. However, given how sporadic and volatile Brexit developments are, it is equally likely that whatever occurs it will produce an equally market-moving reaction.
Disclaimer:
The views in this article only represent the author's personal views, and do not constitute investment advice on this platform. This platform does not guarantee the accuracy, completeness and timeliness of the information in the article, and will not be liable for any loss caused by the use of or reliance on the information in the article.
Read more

Euro May Extend Gains vs NOK and Aim to Re-Test 11-Year High
The Euro may rise vs the Norwegian Krone this week and push EURNOK to retest the 11-year high at 10.0972, a level not reached since the 2008 financial crash.

US Dollar May Rise vs NOK if Norges Bank Trims Hawkish Outlook
The US Dollar may rise vs the Norwegian Krone if the Norges Bank scales back its hawkish outlook against the backdrop of slower regional and global growth.

SEK, NOK Brace for Turbulence Ahead of FOMC and Sweden GDP
The Swedish Krona and Norwegian Krone will likely experience unusually high volatility with Swedish GDP, the FOMC rate decision and other high-event risk in the week ahead.

USDNOK Plunges, Breaks 15-Month Support on Hawkish Norges Bank
USDNOK fell over one percent after the Norges Bank chose to raise its benchmark interest rate and provided a hawkish outlook for monetary policy.
WikiFX Broker
Latest News
Good News Malaysia: Ready for 5% GDP Growth in 2025!
How to Automate Forex and Crypto Trading for Better Profits
Is the stronger dollar a threat to oil prices?
Rising Risk of Japan Intervening in the Yen's Exchange Rate
How Far Will the Bond Market Decline?
U.S. to Auction $6.5 Billion in Bitcoin in 2025
Standard Chartered Secures EU Crypto License in Luxembourg
Trading Lessons Inspired by Squid Game
Is Infinox a Safe Broker?
How Did the Dollar Become the "Dominant Currency"?
Currency Calculator


