简体中文
繁體中文
English
Pусский
日本語
ภาษาไทย
Tiếng Việt
Bahasa Indonesia
Español
हिन्दी
Filippiiniläinen
Français
Deutsch
Português
Türkçe
한국어
العربية
Dow Jones Outlook: Index Awaits US GDP on Shaky Ground
Abstract:The Dow Jones will await Thursdays release of annualized GDP data as US indices stand on a shaky fundamental backdrop and industrials stumble under pressure.
Dow Jones Outlook Talking Points:
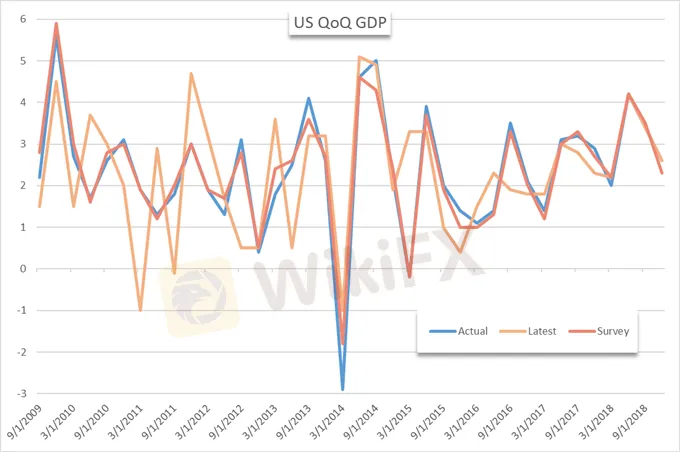
US GDP is expected at 2.40%, but a recent deterioration in other economic data may see the figure disappoint
The Dow Jones trades at a precarious position with storm clouds above US markets
For a deeper look into global equities, sign up for my weekly webinar - Stock Market Catalysts in the Week Ahead
Dow Jones Outlook: Index Awaits US GDP on Shaky Ground
The Dow Jones will look to Thursday‘s release of the finalized GDP data from the United States. While the initial fourth quarter figure – which often has a larger market reaction - was released a month ago, the final yearly data print is still subject to revisions and could deliver a shock to the Industrial Average given the landscape. The current standing of the Dow Jones and other US indices appears vulnerable and a disappointing conclusion to last year’s data could take advantage of that vulnerability.
US Gross Domestic Product Quarter over Quarter (Chart 1)

See how IG clients are positioned on various currencies and assets with IG Client Sentiment Data.
According to the put-call ratio of the S&P 500, some traders have braced for bearish price action – possibly envisioning a negative data print or a continuation of the recent risk-off attitude due to other factors. The ratio of puts to calls on the index climbed to 0.98 in Wednesday trading, the highest since January 10 when the S&P 500 traded below 2,600 and the ratio was 1.
S&P 500 Price and Put-Call Ratio (Chart 2)

That said, some sectors may be more vulnerable than others. Manufacturing is one of the more sensitive industries to economic production as the outlook for growth can help or hurt companies that rely on continuous expansion.
Dow Jones Price Chart: Daily Time Frame (January 2018 – March 2019) (Chart 3)

Dow Jones price chart overlaid with ratio of S&P 500 to XLI ETF in red
The industrial-tracking XLI ETF has recently lagged the broader S&P 500 likely due to considerable concern over slowing global growth and in part because of Boeings recent struggles. A poor GDP print would prove troublesome for the industry and likely contribute to further underperformance in the sector.
Dow Jones Price Chart: 4 – Hour Time Frame (October 2018 – March 2019) (Chart 4)

Today, the index finds itself trading indecisively in a narrowing wedge, with opportunities for a continuation higher – despite the apparent fundamental headwinds.
Disclaimer:
The views in this article only represent the author's personal views, and do not constitute investment advice on this platform. This platform does not guarantee the accuracy, completeness and timeliness of the information in the article, and will not be liable for any loss caused by the use of or reliance on the information in the article.
Read more

High Volatility Economic Events for This Week (GMT+8)
This week, key economic events expected to generate high volatility include China's Q2 GDP and retail sales data, impacting CNY. The US will release Core Retail Sales and Philadelphia Fed Manufacturing Index, affecting USD. The UK's CPI data will influence GBP, and the ECB Interest Rate Decision and Press Conference will impact EUR. These events will drive significant market movements due to their influence on monetary policy and economic outlooks.

US Dollar Price Outlook: EUR/USD Eyes GDP, Trade Balance Data
The US Dollar could be at risk in light of upcoming economic data releases during Thursday's trading session with Q2 GDP and July Advanced Goods Trade Balance serving as potential catalysts for volatility.

S&P 500 Forecast: Stocks Threaten Breakdown as TLT ETF Soars
The S&P 500 fluctuated between losses and gains on Thursday before finishing narrowly higher. Meanwhile, investors continued to clamor for safety in bonds.

GBP/USD: Pound Sterling Eyes Q2 GDP Amid Rising Brexit Risks
The British Pound faces major event risk with UK Q2 GDP data due for release Friday which looks to provide the latest health check on the British economy amid prolonged Brexit uncertainty.
WikiFX Broker
Latest News
XM - Featured Broker in WikiFX SkyLine Guide
BUX and PrimaryBid Partnership Opens IPO Access for EU Retail Investors
Plus500 Users Count Surges to 121K with Average Deposits Reaching $6,150
Coinbase Launches Tool to Simplify AI Agent Creation for Crypto Tasks
Illegal Bitcoin Mining Is Draining Millions from Malaysia’s National Company
Angel One is an Ideal choice for you ?
Canadian Watchdog Warns Against Capixtrade
StoneX Group Strengthens Indian Presence with Bullion Exchange Membership & New Offices
Indonesian Woman Lured into S$1.3 Million Forex Scam by Friend
6 Trading Platforms That May Put Your Money at Risk
Currency Calculator


