简体中文
繁體中文
English
Pусский
日本語
ภาษาไทย
Tiếng Việt
Bahasa Indonesia
Español
हिन्दी
Filippiiniläinen
Français
Deutsch
Português
Türkçe
한국어
العربية
Dow Jones Technical Analysis: Index Continues to Decline
Abstract:The Dow Jones Industrial Average continued to decline during its recent trading at the intraday levels, to record losses for the fourth consecutive session, by -0.56%. It lost the index towards -184.74 points, to settle at the end of trading at the level of 32,817.39, after it declined in Monday's trading by -2.37%.
The Dow Jones Industrial Average continued to decline during its recent trading at the intraday levels, to record losses for the fourth consecutive session, by -0.56%. It lost the index towards -184.74 points, to settle at the end of trading at the level of 32,817.39, after it declined in Monday's trading by -2.37%.

With a trading volume of more than 553.7 sheets, the last indexs decline came as a continuation of its series of losses for the previous three sessions, as 22 components of the 30 indices fell, the most prominent of which was a percentage loss of Coca-Cola Co. It fell by -3.96%, and Procter & Gamble Co. shares. by -3.96%, and UnitedHealth Group Inc. shares. By -2.76%.
Concerns about the clashes between Russia and Ukraine and the mounting sanctions imposed on the Kremlin have pushed up the prices of all commodities, raising concerns about inflation. It can influence the Federal Reserve's decisions about the speed and size of interest rate hikes, which could slow economic growth.
In US economic data, the National Federation of Independent Business said its small business optimism index fell 1.4 points to 95.7 in February, the lowest level in one year. The largest number of small businesses since 1981 said high inflation was their main concern, with many increasing prices to offset their rising costs.
The US trade deficit rose 9.4% in January to a record $89.7 billion as the US bought more foreign oil, cars, and other goods.
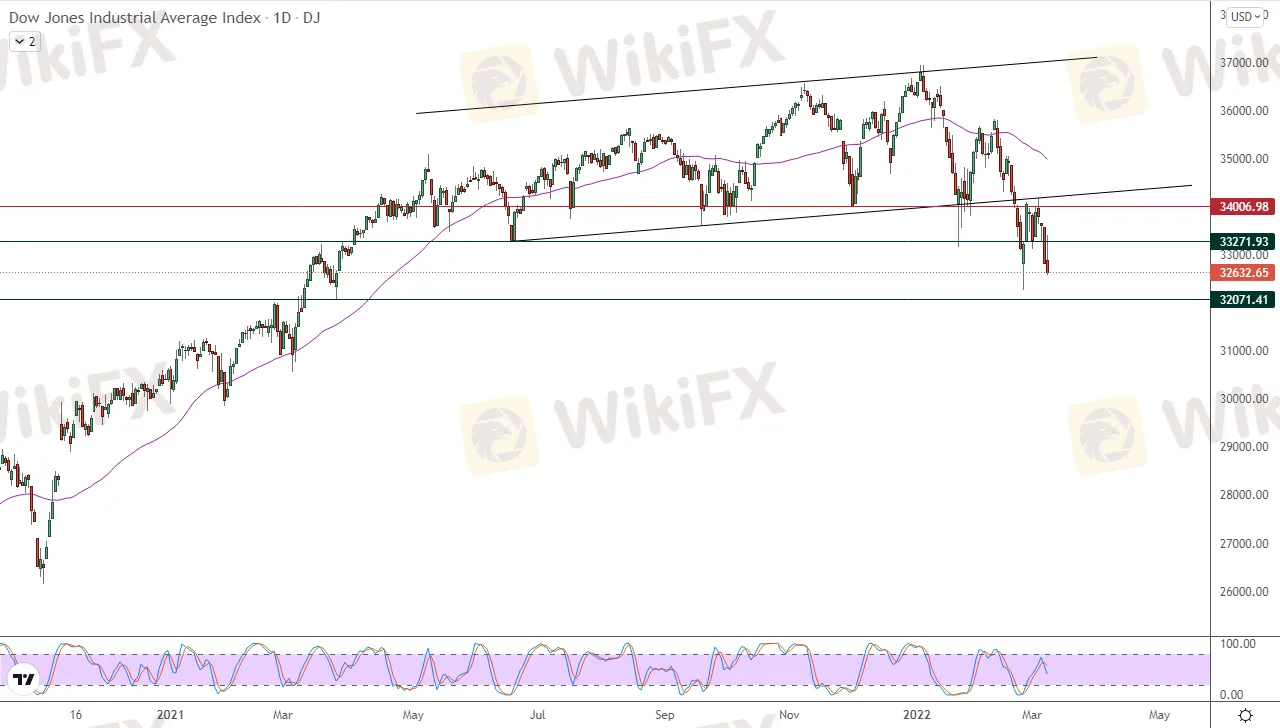
Technically, the indexs decline comes for the fourth consecutive day, amid its being affected by the breaking of a minor bullish trend line in the short term. It will then announce the continuation of the bearish corrective trend, with continuous negative pressure due to its trading below the simple moving average. This is shown in the attached chart for a (daily) period of time, as we note In the midst of this, negative signals started to appear in the RSIs, after they reached clear overbought areas, to confirm the index with its recent closing of breaking the important support level 33,271.93.
Therefore, our expectations indicate the continuation of the index's decline during its upcoming trading, throughout its stability below the level of 33,271.93, to target the first support levels at the level of 32,071.41.
Disclaimer:
The views in this article only represent the author's personal views, and do not constitute investment advice on this platform. This platform does not guarantee the accuracy, completeness and timeliness of the information in the article, and will not be liable for any loss caused by the use of or reliance on the information in the article.
WikiFX Broker
Latest News
ASIC Sues Binance Australia Derivatives for Misclassifying Retail Clients
WikiFX Review: Is FxPro Reliable?
Malaysian-Thai Fraud Syndicate Dismantled, Millions in Losses Reported
Trading frauds topped the list of scams in India- Report Reveals
AIMS Broker Review
The Hidden Checklist: Five Unconventional Steps to Vet Your Broker
YAMARKETS' Jingle Bells Christmas Offer!
WikiFX Review: Something You Need to Know About Markets4you
Revolut Leads UK Neobanks in the Digital Banking Revolution
Fusion Markets: Safe Choice or Scam to Avoid?
Currency Calculator


