简体中文
繁體中文
English
Pусский
日本語
ภาษาไทย
Tiếng Việt
Bahasa Indonesia
Español
हिन्दी
Filippiiniläinen
Français
Deutsch
Português
Türkçe
한국어
العربية
How to Find the Trend Using Moving Averages
Abstract:Moving averages can also be used to assist you determine the trend. The most straightforward method is to simply plot a single moving average on the chart. When price movement tends to stay above the moving average, it indicates that the market is generally in a UPTREND. Price movement that tends to stay below the moving average implies that the market is in a DOWNTREND.
Moving averages can also be used to assist you determine the trend.
The most straightforward method is to simply plot a single moving average on the chart.
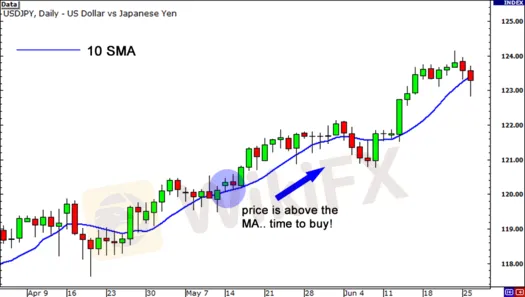
When price movement tends to stay above the moving average, it indicates that the market is generally in a UPTREND.
Price movement that tends to stay below the moving average implies that the market is in a DOWNTREND.

The difficulty is that it is overly simplistic.
Let's imagine USD/JPY has been on a downward trend, but a news article causes it to spike upward.

The price is currently ABOVE the moving average, as you can see.
You think to yourself. This duo appears to be poised to change directions. “Now is the time to get this sucker!”
So you go ahead and do it. You purchase a billion units because you believe the USD/JPY will rise.

Traders simply reacted to the news, but the pattern continued and the price continued to fall!
Some traders, and we recommend that you do the same, plot many moving averages on their charts rather than just one.
This gives them a clearer indication of whether the pair is heading upwards or downwards, based on the order of the indicators.
Allow me to explain.
The “faster” moving average should be above the “slower” moving average in an uptrend, and vice versa in a downtrend.
Let's imagine we have two MAs: a 10-period MA and a 20-period MA, for example. It would appear like this on your graph:

A daily chart of the USD/JPY is shown above.
The 10 SMA has been above the 20 SMA throughout the rise.
As you can see, moving averages can be used to determine if a pair is trending up or down.
When you combine this with your understanding of trend lines, you can determine whether to go long or short on a currency pair.
Adding more than two moving averages to your chart is also an option.
You can identify whether the pair is in an uptrend or a decline by looking at the sequence of the lines (faster MA over slower MA in an uptrend, slower MA over faster MA in a downtrend).
Disclaimer:
The views in this article only represent the author's personal views, and do not constitute investment advice on this platform. This platform does not guarantee the accuracy, completeness and timeliness of the information in the article, and will not be liable for any loss caused by the use of or reliance on the information in the article.
Read more

Forex is a game that I enjoy playing
These champions have one thing in common: they not only work their butts off, but they also enjoy what they do.

Wait patiently. Maintain your discipline
"Patience is the key to everything," American comic Arnold H. Glasgow once quipped. The chicken is gotten by hatching the egg rather than crushing it."

There isn't a Holy Grail to be found!
Ask any Wall Street quant (the highly nerdy math and physics PhDs who build complicated algorithmic trading techniques) why there isn't a "holy grail" indicator, approach, or system that generates revenues on a regular basis.

Concentrate on the Process. Profits aren't a priority
We've designed the School of WikiFX as simple and enjoyable as possible to help you learn and comprehend the fundamental tools and best practices used by forex traders all over the world, but keep in mind that a tool or strategy is only as good as the person who uses it.
WikiFX Broker
Latest News
What is a Stop Out Level?
Challenges of A-Book Execution
Japanese Candlestick Anatomy
What is the difference between support and resistance?
Candlesticks with Support and Resistance
Dual Candlestick Patterns
Basic Japanese Candlestick Patterns
How to Place Your Stop Using Fibonacci to Lose Less Money
What is the Difference Between Double Tops and Double Bottoms?
Bearish and Bullish Pennants and How to Trade Them
Currency Calculator


