简体中文
繁體中文
English
Pусский
日本語
ภาษาไทย
Tiếng Việt
Bahasa Indonesia
Español
हिन्दी
Filippiiniläinen
Français
Deutsch
Português
Türkçe
한국어
العربية
S&P 500 Forecast: Fresh All-Time High May Set Narrative for Q2 Trading
Abstract:S&P 500 Forecast: Fresh All-Time High May Set Narrative for Q2 Trading
S&P 500 - TALKING POINTS
S&P 500 breaks above 4,000 mark to start Q2 after ISM print impresses investors
President Joe Bidens Thursday infrastructure announcement helps lift sentiment
Asia-Pacific markets set for quiet open with Australia, New Zealand markets closed
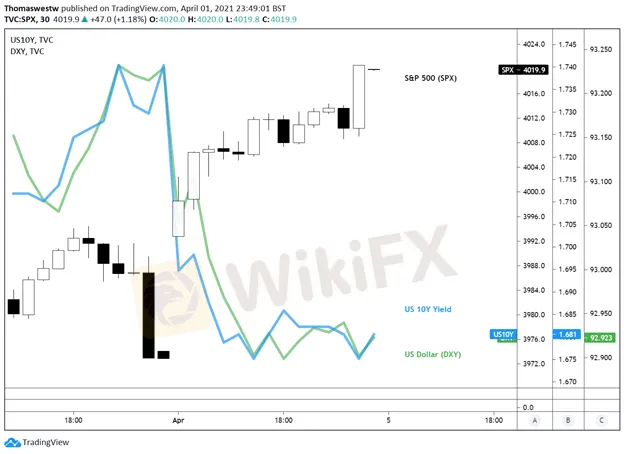
The S&P 500 put in a fresh record-high close on Thursday after a stronger-than-expected manufacturing report from the Institute of Supply Management (ISM) injected bullish energy into equity markets. US manufacturers, according to the report, are being overrun with heavy demand, indicated by a sharp swing higher in new orders. The benchmark S&P 500 index closed just shy of 4,020 after rising 1.18% on the day.
Technology stocks also rose strongly into the extended US holiday weekend, with the Nasdaq 100 index recording a 1.82% rally. Elsewhere, the small-cap Russell 2000 index gained 1.50%, while the Dow Jones Industrial Average (DJIA) climbed 0.52%. The US Dollar weakened against most major G10 peer currencies.
Thursday marked the end of the trading week for the United States, with stock markets set to reopen on Monday following the Easter holiday. Bond markets, however, will see a shortened trading day on Friday. Speaking of bond markets, Treasuries saw buying across most tenures except the 2-year. The benchmark 10-year yield fell 4.15%.
The US government bond market recorded its worst loss in years, particularly in long-dated Treasuries. The iShares 20+ Year Treasury Bond ETF – composed of bonds with a maturity over 20 years – saw a violent 14.83% decline in the first quarter. The roiled Treasury market will likely remain in focus going forward as investors remain doubtful that the Fed wont prematurely raise rates amid a stimulus-fueled domestic economy that continues to heat up.
S&P 500, US DOLLAR (DXY), 10-YEAR TREASURY YIELD – 30 MINUTE CHART
Chart created with TradingView
FRIDAY‘S ASIA-PACIFIC OUTLOOKThe Asia-Pacific session is set to be a bit quieter than usual with closed markets in Australia and New Zealand for the Good Friday holiday. Australia’s ASX 200 gained 0.56% on Thursday to kick off the second quarter. Equity markets across the rest of the APAC region also gained. Market sentiment received a boost after US President Joe Biden outlined his infrastructure plan early Thursday when the US leader called for a $2.25 trillion investment in roads, bridges, airports, and green energy infrastructure.
The Australian Dollar is moving higher on broader Greenback weakness. AUD/USD initially was moving lower on Thursday, threatening to break below a key support level from a Head and Shoulders pattern, but subsequently shifted higher later in the session. The move higher comes despite a worse-than-expected trade report out of Australia that showed weakness in exports.
Friday‘s economic event calendar is void of high- and medium-impact events, according to the DailyFX Economic Calendar. Thailand will see business confidence and unemployment data cross the wires, while India will release its foreign exchange reserves for the week ending March 26. While US markets are closed tomorrow, traders will have a close eye on the highly-anticipated non-farm payrolls report, with the consensus estimate slated to print at 647k, which would nearly double the prior month’s figure.
S&P 500 TECHNICAL OUTLOOKThe S&P 500s break above the 4,000 level saw prices rise above the upper trendline of a Rising Wedge pattern. While technically a bearish pattern, the break above resistance highlights the underlying strength in US markets. And now, with a full retracement of the last leg lower, the 161.8% Fibonacci retracement shifts into view at the 4,064 level.
Alternatively, a move back into the wedge could be viewed as a bearish development. However, given the broader trend higher, any pullback will likely be transitory. The Relative Strength Index (RSI) is showing some bearish divergence, although the MACD oscillator is trending higher, pointing to healthy momentum.
S&P 500 DAILY CHART
Chart created with TradingView
----------------
WikiFX, the world's No.1 broker inquiry platform!
Use WikiFX to get free trading strategies, scam alerts, and experts experience!
Android : cutt.ly/Bkn0jKJ
iOS : cutt.ly/ekn0yOC

Disclaimer:
The views in this article only represent the author's personal views, and do not constitute investment advice on this platform. This platform does not guarantee the accuracy, completeness and timeliness of the information in the article, and will not be liable for any loss caused by the use of or reliance on the information in the article.
Read more

S&P 500 Outlook: Fed Rate Cut Speculation & Market Volatility | March 20, 2024
Navigating Uncertainty: Insights for Traders & Investors
New market forecast from Goldman Sachs says stocks look vulnerable
After revamping the way it interprets market sentiment, Goldman Sachs says stocks will slip, and are vulnerable if the economy doesn't improve.
Mega-cap stocks face rising profit threats, investing firm says
A $60 billion investing firm says profit advantages that have helped build US corporations into giants are fading, limiting the stocks' potential.
Next stock market sell off: New record highs are uniquely vulnerable
Two major stock indexes set record highs this week, but some experts say it's a warning sign that only a few individual stocks are reaching new highs.
WikiFX Broker
Latest News
Geopolitical Events: What They Are & Their Impact?
Top 10 Trading Indicators Every Forex Trader Should Know
Why Do You Feel Scared During Trade Execution?
Currency Calculator


