简体中文
繁體中文
English
Pусский
日本語
ภาษาไทย
Tiếng Việt
Bahasa Indonesia
Español
हिन्दी
Filippiiniläinen
Français
Deutsch
Português
Türkçe
한국어
العربية
The Stochastic Indicator Applied to EUR/USD
Abstract:Looking for the Holy Grail, the miracle indicator that will do everything for them and especially make them earn fortunes everyday, here is the daily quest of many traders.
Looking for the Holy Grail, the miracle indicator that will do everything for them and especially make them earn fortunes everyday, here is the daily quest of many traders.
This quest for the improbable answer takes them away from the principal. What if the solution wasn't much simpler? ... Just knowing how to use a few basic indicators they have on any chart platform.
I am going to talk about an indicator that I particularly like, I mean the stochastics.
I will not develop here the standard way to use it, i.e. using the levels placed at 80 and 20 to determine an area of overbought or oversold.
In fact, we can use the stochastics differently.
For this we will have to identify the support or resistance levels and take an interest in the stochastics when the curve breaks one of these lines, while the stochastic cuts its signal line.
The more the latter will be cut near the line of 80 in case of a buy or 20 in case of a sell, the more interesting the signal will follow, contrary to what is recommended by most traders.
Take the time to look at the graphs in the past and you will see the merits of this technique. An interesting time frame to work with this is in one hour period, but you can test this technique in other time frames.
Here are the examples that let you know better the principle of this method:

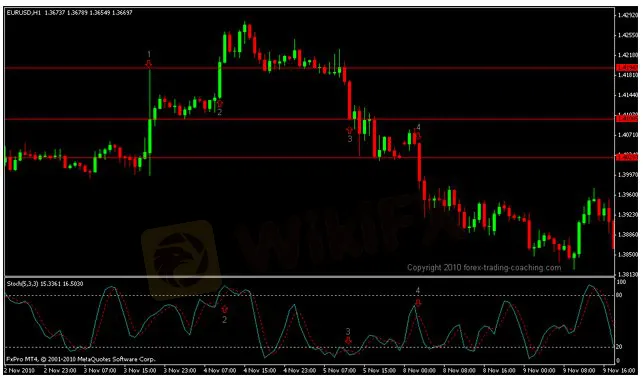
The No.1 on the chart marks a final high.
In the No. 2, the green candle cuts this higher. Simultaneously the stochastic cuts its signal line at the point marked in the No. 2. This happens at the level 80 of overbought. Most traders are then reluctant to start a trade and yet ... at the next candle that it was possible to earn 58 pips!
In the No. 3, the red candle cuts the support line drawn in red, compared to previous lows and simultaneously the stochastic cuts its signal line at the No. 3 and this below the oversold line of 20 ... I am sure that many traders did not start this trade because we were oversold and yet ... there was a possibility to gain 60 pips in a short term.
In the No. 4, the red candle cuts the support line and the stochastic cuts its signal line at the same time, that was to gain 67 pips in a short term...
(Source: https://www.abcbourse.com/analyses/chronique-l_indicateur_stochastique_applique_a_l_eur_usd-673)
Disclaimer:
The views in this article only represent the author's personal views, and do not constitute investment advice on this platform. This platform does not guarantee the accuracy, completeness and timeliness of the information in the article, and will not be liable for any loss caused by the use of or reliance on the information in the article.
Read more

KVB Market Analysis | 23 August: JPY Gains Ground Against USD as BoJ Signals Possible Rate Hike
JPY strengthened against the USD, pushing USD/JPY near 145.00, driven by strong inflation data and BoJ rate hike expectations. Japan's strong Q2 GDP growth added support. However, USD gains may be limited by expectations of a Fed rate cut in September.

KVB Market Analysis | 22 August: Gold Stays Strong Above $2,500 as Fed Rate Cut Hints Loom
Gold prices remain above $2,500, near record highs, as investors await the Federal Open Market Committee minutes for confirmation of a potential Fed rate cut in September. The Fed's dovish shift, prioritizing employment over inflation, has weakened the US Dollar, boosting gold. A recent revision showing the US created 818,000 fewer jobs than initially reported also strengthens the case for a rate cut.

KVB Market Analysis | 21 August: USD/JPY Stalls Near 145.50 Amid Diverging Economic Indicators
USD/JPY holds near 145.50, recovering from 144.95 lows. The Yen strengthens on strong GDP, boosting rate hike expectations for the Bank of Japan. However, gains may be limited by potential US Fed rate cuts in September.

KVB Market Analysis | 20 August: Gold Prices Remain Near Record High Amid US Rate Cut Expectations
Gold prices remain near record highs, driven by expectations of a US interest rate cut and a weakening US Dollar. Investors are focusing on the upcoming Jackson Hole Symposium, where Fed Chair Jerome Powell's speech will be closely watched for clues on the Fed's stance. Additionally, the release of US manufacturing data (PMIs) is expected to influence gold's direction.
WikiFX Broker
Latest News
CFI Partners with MI Cape Town, Cricket Team
Doo Financial Expands Reach with Indonesian Regulatory Licenses
Volkswagen agrees deal to avoid Germany plant closures
Geopolitical Events: What They Are & Their Impact?
Webull Canada Expands Options Trading to TFSAs and RRSPs
CySEC Launches Redesigned Website Packed with New Features
WikiEXPO Global Expert Interview: Simone Martin—— Exploring Financial Regulation Change
TradingView Launches Liquidity Analysis Tool DEX Screener
MultiBank Group Wins Big at Traders Fair Hong Kong 2024
WikiFX Review: Is PU Prime a decent broker?
Currency Calculator


