简体中文
繁體中文
English
Pусский
日本語
ภาษาไทย
Tiếng Việt
Bahasa Indonesia
Español
हिन्दी
Filippiiniläinen
Français
Deutsch
Português
Türkçe
한국어
العربية
How to Identify the Breakout or Rejection Movement Based on Candlestick Formation
Abstract:Most of the techniques applied to analyze the market technically are depending on two main situations, which are BREAKOUT and REJECTION.
Most of the techniques applied to analyze the market technically are depending on two main situations, which are BREAKOUT and REJECTION. Regardless of methods, whether using the indicator or the manual approach, all analytical methods will be based on either BREAKOUT or REJECTION.
Before I continue with the tips on identifying the best breakout or rejection, let's get familiar first with what BREAKOUT and REJECTION are.
BREAKOUT and REJECTION are graph reactions to a zone that is viewed as responsive frequency of graph movement. This zone is called as the key level or SUPPORT & RESISTANCE.
Support and resistance is generated when the graph reacts at least twice to a certain zone. In this example, I will use the PRICE ZONE as a guide.
Repeated graph responses to a certain price zone can be used as a guide to mark the “key level”. Once the key level has been identified, then the focus is entirely for the zone on finding entry chances based on the graph response either BREAKOUT or REJECTION.
In short, SUPPORT and RESISTANCE are zones where the graph responds at least twice, while BREAKOUT and REJECTION are the reactions or responses of the graph to that zone.
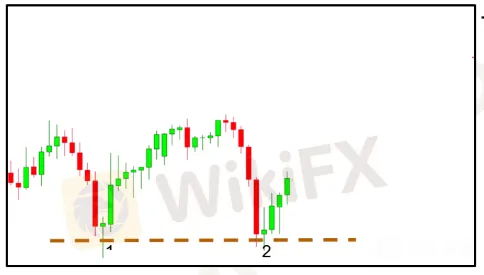
Please refer to the diagram below where the graph reactions appear twice at the lowest price. The chance to execute BUY or SELL depends on how the graph responds afterward.

Rejection
Rejection is a condition whereby the graph touches a support & resistance zone and fails to cross the zone and reverse back to its original zone.
Breakout
Breakout is a situation whereby the graph is able to cross the support & resistance zone and creates new price in a new zone.
We can predict whether the graph will perform a rejection or breakout in the support and resistance zone based on a series of candlestick movements approaching that particular zone.
This series of movements are called candlestick formation and it helps traders to visualize whether the market will perform a breakout or a rejection.
As a result, this series of candlestick formation structures depict the strength of the graph movement as it approaches the support & resistance zone. The emerging of candlestick formation shows an increasing graph movement momentum, while the declining graph movement formations show a decreasing momentum.
So, let's apply this momentum to BREAKOUT and RESISTANCE zone.

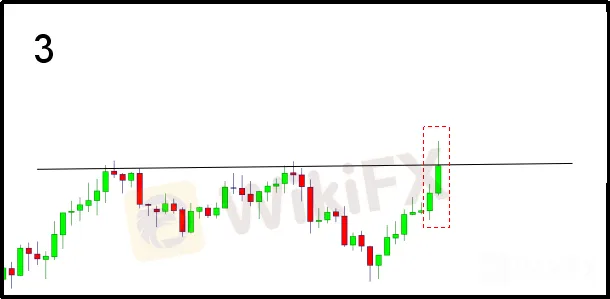
The graph has shown its reactions at least twice at a similar price. The identical response points in the form of the price are marked in the form of one straight line called as key level.

Attention is given to the key level as the graph begins to move closer to the key level. In this particular situation, many traders will often expect to execute SELL once the graph touches the key level on the basis of the graph has responded to the price previously.

In this existing situation based on the diagram above, many retail traders will make mistakes in which they tend to execute SELL. Two reasons led to the mistakes. Firstly, the graph has reacted to the same price before; secondly, the latest candlestick depicts that it failed to breach the zone or the price again.
In fact, we need to look at how the graph approaches the zone. Whether it has the potential for rejection or breakout attempt, it really depends on the candlestick formation approaching that particular zone or price.
A series of candlestick sequences approaching that price or zone will reflect the current market strength as it approaches that zone or price.
Focus on the size of the candlestick approaching that price or zone. This size of candlestick can help us to identify the momentum of the graph movement as it approaches that zone or price.
If the size of the candlestick approaching a zone is greater than before, it portrays the strength of the graph momentum is increasing. Likewise, if the size of the candlestick approaching the zone is smaller than before, it depicts a decreasing momentum of the graph movement.

From the example above, the graph creates an increased momentum as it approaches the responsive zone. Although the candlestick reacts at that zone, the growth of momentum will strengthen the market to continue the original movement ahead without reversal.
Therefore, in the above situation, please avoid executing SELL if you notice the graph momentum is increasing as it approaches a certain zone. You will be more vulnerable to the risk of loss if the graph shows a growth in its momentum.
Conclusion
Entry Options Based on Support & Resistance Rejection
1) If you are looking for a position that depends on the rejection zone, make sure the graph forms as it approaches that particular zone.
2) Sometimes, even if the graph increases its momentum as it approaches the support & resistance zone, you still have the opportunity for entry towards reversal movement but with the following conditions:
A. Wait for the next candlestick formation to complete.
B. If the next candlestick shows a momentum loss once again, the graph potentially makes rejection or reversal at that particular zone.
C. Open the market position only until the candlestick shows that momentum loss is complete (closed candle).
Entry Options Based on Support & Resistance Breakout
1) If you are looking for a position that depends on the breakout zone, make sure the graph creates momentum gain as it approaches that particular zone.
2) Make sure the candle is fully complete (closed candle) to evaluate the momentum gain of the graph.
3) Only perform an entry when the breakout candlestick size from the support zone and resistance zone is greater than before.
Summary
For entry point that is based on reversal or rejection, look forward to MOMENTUM LOSS.
For entry point that relies on a breakout, look forward to MOMENTUM GAIN.
Hopefully, this article can help you create a clear plan or evaluation before performing any entry.
The best entry points are founded through valid observations or evaluations. Traders will be more confident in their actions if they know the cause and motive to perform an entry. It must be based on the overt and clear reasons that appear in front of their eyes. It cannot be made up or fabricated without sound reason.
May each of my articles and knowledge sharing right now and beforehand benefit you and can help you create a profitable trade. Thank you.
Disclaimer:
The views in this article only represent the author's personal views, and do not constitute investment advice on this platform. This platform does not guarantee the accuracy, completeness and timeliness of the information in the article, and will not be liable for any loss caused by the use of or reliance on the information in the article.
WikiFX Broker
Latest News
ASIC Sues Binance Australia Derivatives for Misclassifying Retail Clients
Geopolitical Events: What They Are & Their Impact?
Top 10 Trading Indicators Every Forex Trader Should Know
WikiFX Review: Is FxPro Reliable?
Malaysian-Thai Fraud Syndicate Dismantled, Millions in Losses Reported
Trading frauds topped the list of scams in India- Report Reveals
Why Do You Feel Scared During Trade Execution?
WikiFX Review: Something You Need to Know About Markets4you
Revolut Leads UK Neobanks in the Digital Banking Revolution
Fusion Markets: Safe Choice or Scam to Avoid?
Currency Calculator


