简体中文
繁體中文
English
Pусский
日本語
ภาษาไทย
Tiếng Việt
Bahasa Indonesia
Español
हिन्दी
Filippiiniläinen
Français
Deutsch
Português
Türkçe
한국어
العربية
Bitcoin Price Chart is Coiled like a Spring, will it Bounce or Break?
Abstract:Bitcoin has seen its trading range narrow as bulls and bears hash out price action on the ledge of nearby support which, if broken, could see BTCUSD price slump another 20%.
Bitcoin Price Forecast:
Bitcoin is up 153% in the year-to-date, but recent price action suggests the cryptos bullish trend is threatened
To that end, an ascending trendline from mid-May could mark the line in the sand for medium-term BTCUSD price
Interested in cryptocurrency? Check out our Bitcoin Predictions & Facebook Libra Podcast with Tone Vays
Bitcoin Price Chart is Coiled like a Spring, will it Bounce or Break?
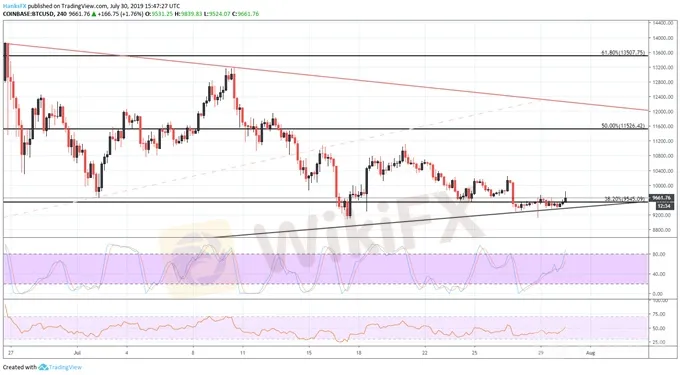
After surging 260% in 2019 to nearly $14,000 last month, Bitcoin is taking a breather and threatening a critical tailwind to its continuation higher. The ascending trendline from mid-May provided support in June and has done so again in late July. A series of recent tests have probed the line, but bulls appear unwilling to surrender at this time. That said, hourly stochastic RSI is tiptoeing into overbought territory and could see bears pressure price back down to the level – which now enjoys confluence with a Fibonacci level at $9,545. If confluent support is unable to rebuke bears at this level, it is a worrisome sign for Bitcoin in the coming days.
Interested in longer-term trades? Check out our Third Quarter Forecasts for Gold, EURUSD and more.
Bitcoin Price Chart: 1 – Hour Time Frame (June – July) (Chart 1)

Chart created in TradingView
Over the longer-term however, stochastic RSI is wading in oversold territory as RSI continues to trend lower alongside price. Should the confluence of support keep Bitcoin afloat and allow bulls to retake control, resistance may reside at the 50% retracement level around $11,525 and around $12,000 marked by the descending trendline from Junes high. If price holds above support, BTC may work itself into somewhat of a wedge marked by the converging trendlines.
Bitcoin Price Chart: Daily Time Frame (May – July) (Chart 2)

Chart created in TradingView
If, on the other hand, Bitcoin bulls are unable to hold above $9,545, a break beneath could quickly accelerate into a larger move as bullish bets unfold and the overarching trend higher is called into question. In this circumstance, initial support would look to reside around $7,093 – marked by the 23.6% Fib level. Further, Bitcoin volatility has been relatively muted as the cryptocurrency slowly bleeds to support but a failure at this level would likely spark volatility as traders look to reposition amid the new technical landscape.
Disclaimer:
The views in this article only represent the author's personal views, and do not constitute investment advice on this platform. This platform does not guarantee the accuracy, completeness and timeliness of the information in the article, and will not be liable for any loss caused by the use of or reliance on the information in the article.
Read more

5 things you should know about investlite.com
InvestLite is an offshore regulated broker, offering rather competitive trading conditions, including a leverage level of 1:500 and tight spreads. The trading instruments include Crypto, Commodities, Stocks, Indices and Metals. The trading platforms offered include Web trader and Mobile applications only. They also claim to take care of the safety of the funds of the traders, find out if it’s true in the full InvestLite review.

We make trading available for everybody
ExpertOption have been working continuously to transform

EUR/USD Price Analysis: Trapped between the 4-hour 50 and 100-SMA, around 1.1300
The shared currency advances against the greenback, up some 0.10%. The US Dollar Index, which measures the buck’s performance against six rivals, is flat at 96.16. EUR/USD: Mild bearish, but it needs a break below the 50-SMA to resume the downward move.

What is TMGM?
TMGM is a Global broker offering traders access to CFDs in Forex, Metals, Energies, Indices, Shares and CryptoCurrencies.
WikiFX Broker
Latest News
Spotware Unveils cTrader Store, Global Marketplace for Algo Creators
Elderly Trader Loses RM2.1M in WhatsApp Forex Scam
Gigamax Scam: Tracking Key Suspects in RM7 Million Crypto Fraud
CFI Partners with MI Cape Town, Cricket Team
Doo Financial Expands Reach with Indonesian Regulatory Licenses
WikiFX Review: Is IQ Option trustworthy?
5 Questions to Ask Yourself Before Taking a Trade
Quadcode Markets: Trustworthy or Risky?
Avoid Fake Websites of CPT Markets
Webull Canada Expands Options Trading to TFSAs and RRSPs
Currency Calculator


