简体中文
繁體中文
English
Pусский
日本語
ภาษาไทย
Tiếng Việt
Bahasa Indonesia
Español
हिन्दी
Filippiiniläinen
Français
Deutsch
Português
Türkçe
한국어
العربية
Bitcoin (BTC) Price - Bullish Momentum Slows, Support Strengthens
Abstract:The latest Bitcoin rally is on hold, but longer-term support continues to build in the largest crypto and suggests higher prices ahead.
Bitcoin (BTC) Price Outlook, Chart and Analysis:
比特币(BTC)价格展望,图表和分析:
Bitcoin rally currently capped but higher prices cannot be discounted.
比特币反弹目前受限,但价格上涨不能打折。
Supportive technical should fuel the next move higher.
支持性技术应推动下一步走高。
IG Client Sentiment Datashow how retail are positioned in a variety of cryptocurrencies. See how daily and weekly positioning can affect our trading bias. Bitcoin (BTC) trade data shows 79.9% of traders are net-long, a strong contrarian bearish signal. However, recent daily and weekly changes in sentiment suggest a stronger bearish trading bias.
IG Client Sentiment Datashow零售业如何定位于各种加密货币。了解每日和每周定位如何影响我们的交易偏差。比特币(BTC)的贸易数据显示,79.9%的交易者是净多头,这是强烈的逆势看跌信号。然而,最近的每日和每周情绪变化表明更强的看跌交易偏见。
A Guide to Day Trading Bitcoin and Other Cryptocurrencies.
比特币和其他加密货币日交易指南。
Bitcoin (BTC) Bulls Trapped in a Short-Term Holding Pattern
比特币(BTC)公牛陷入短期持股模式
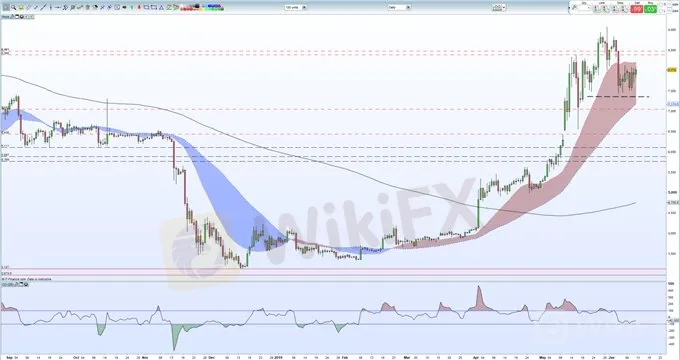
The largest cryptocurrency by market capitalization ($141.5 billion - 55.3%) trades just under $8,000 after having rallied more than 150% since the turn of the year. The longer-term bulls move was confirmed on April 2 when the cash price pierced the 200-day moving average and was strengthened when both the 20- and 50-day moving averages rose above the longer-term ma on April 12 and April 24. Higher volumes since the start of April aided the move higher.
市值最大的加密货币(1415亿美元 - 55.3 %)自年初以来上涨超过150%后,交易价格略低于8,000美元。当4月12日和4月24日的20日和50日移动均线均超过长期移动均线时,4月2日现货价格突破200日移动均线,并确认了长期多头走势。自4月初以来的交易量增加有助于此举走高。
Bitcoin now looks likely to make a fresh attempt at a new 13-month high ($9,080) and is building support around, and just above, $7,450 ahead of the next move. This support needs to hold on the daily chart. The CCI indicator shows Bitcoin bouncing off oversold territory suggesting that bullish momentum is holding.
比特币现在看起来有可能重新尝试新的13个月高点(9,080美元)并且正在建立支撑,而在此之前,在下一步行动之前需要7,450美元。这种支持需要保持在日线图上。 CCI指标显示比特币从超卖区域反弹,表明看涨势头持续。
To the upside, the first level of resistance is at $8,140, followed by old lower highs either side of $8,500 before the 13-month high at $9,080 comes into view. A break and sustained close above here suggests a new attempt at $10,000 before $11,600 to $11,970 come into play in the longer-term.
上行阻力位于8,140美元,其次是历史低位高位。在13个月高点9,080美元之前出现8,500美元。在此处突破并持续收盘表明,在11,600美元至11,970美元之间长期发挥作用的新尝试为10,000美元。
Bitcoin (BTC) Daily Price Chart (September 2018 – June 12, 2019)
比特币(BTC)每日价格走势图(2018年9月 - 2019年6月12日)

Disclaimer:
The views in this article only represent the author's personal views, and do not constitute investment advice on this platform. This platform does not guarantee the accuracy, completeness and timeliness of the information in the article, and will not be liable for any loss caused by the use of or reliance on the information in the article.
Read more

Bitcoin and Ethereum See Strong Recovery
BTC crossed $57,000 while Ethereum jumped by more than 7%.

Crypto startup MoonPay raises $555M to hit $3.4B valuation
Launched in 2019, MoonPay says it has processed more than $2 billion in transactions and hit 7 million users so far.

Analysts pinpoint bull and bear scenarios as Bitcoin price dips below $56K
BTC price dropped below $56,000 again, leading analysts to discuss various bull and bear scenarios for Bitcoin’s short term price action.

Bitcoin Rises Again as Altcoins Outperform
Bitcoin is recovering from a weekend dip as traders anticipate the third U.S. futures-focused bitcoin exchange-traded fund (ETF) listing.
WikiFX Broker
Latest News
ASIC Sues Binance Australia Derivatives for Misclassifying Retail Clients
Geopolitical Events: What They Are & Their Impact?
Top 10 Trading Indicators Every Forex Trader Should Know
WikiFX Review: Is FxPro Reliable?
Trading frauds topped the list of scams in India- Report Reveals
Malaysian-Thai Fraud Syndicate Dismantled, Millions in Losses Reported
Why Do You Feel Scared During Trade Execution?
Revolut Leads UK Neobanks in the Digital Banking Revolution
Fusion Markets: Safe Choice or Scam to Avoid?
SEC Approves Hashdex and Franklin Crypto ETFs on Nasdaq
Currency Calculator


