简体中文
繁體中文
English
Pусский
日本語
ภาษาไทย
Tiếng Việt
Bahasa Indonesia
Español
हिन्दी
Filippiiniläinen
Français
Deutsch
Português
Türkçe
한국어
العربية
EUR/JPY Price Outlook: Trading Above and Below 123.05 – Levels to Watch
Abstract:EUR/JPY Negative Performance Since Mid-April.
EUR/JPY Technical Analysis
Eyes on EUR German Data by The End of This Week.
EUR/JPY Negative Performance Since Mid-April.
See the Q2 Euro and Main Currencies forecast to learn what is likely to drive price action through mid-year!
See the DailyFX Economic Calendar for a comprehensive look at all next weeks data releases.
Just getting started?See our beginners guide for FX traders
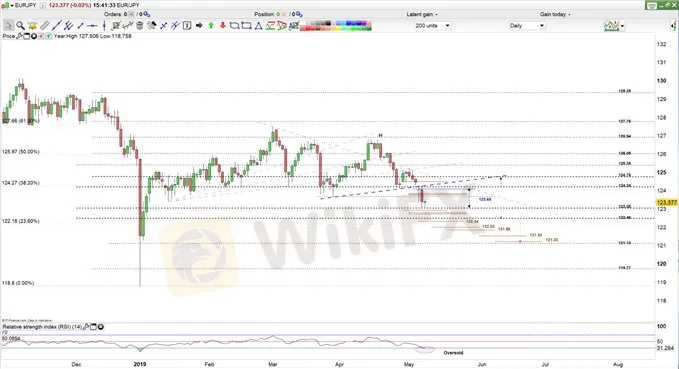
EUR/JPY Daily Price Chart (Oct 2018 – May 08, 2019)

Trading in a Downtrend Pattern After Breaking Below 124.24
Since April 17th failure to break above 126.80 EUR/JPY has been trading in a downtrend pattern based off a formation of a lower high in May 1st and dropping below the April 26th low (124.08) on May 6th. On May 2nd prices closed below 124.76 marking a bearish bias and pushing towards the levels that were mentioned in last week article: Price Action Around 124.76
On May 6th EUR/JPY opened on a downside break away gap, showing more weakness. The pair closed below 124.24 and the uptrend line originated from March 28th. Prices were rejected at this level (124.24) on the following day and pulled back printing 123.10 - the lowest price in more than 4 months.
Relative Strength Index reading has declined from May 1st (46) and has rebounded off the oversold area boundary.
To summarize, a close below 123.05 would suggest more downside movement towards 122.46 contingent on prices breaking the support level at 122.95 and the support zone between 122.80 and 122.74 first. Closing below 122.46 would indicate more bearishness towards 121.13. A series of support levels need to be monitored at 122.34, 122.18 (Fibonacci 23.6% retracement), 122.00, 121.86. 121.53 and 121.22.
What if EUR/JPY RemainsAbove 123.05?
In this case, prices would push towards the high side of the trading range at 124.24. Meanwhile we need to keep an eye on resistance levels at 123.65, the two resistance zones at 123.77 – 123.85 and 124.05 – 124.08.
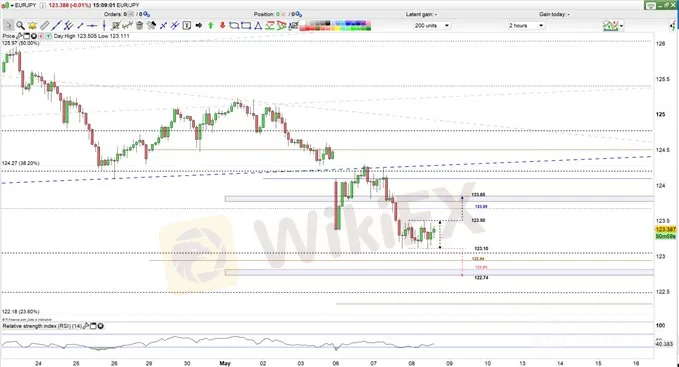
EUR/JPY Price 2Hour Chart (May 08, 2019)

Consolidating between 123.50 and 123.10
Since the May 7th rebound, EUR/JPY has been trading in a narrow range. If prices break and remain above 123.50 it would suggest a bullish sentiment hinting prices might push towards 123.85 if the pair break resistance at 123.65.
If the break were to the downside, and prices trade and remain below 123.10, it would suggest a bearish bias and would move prices towards 122.74 contingent on prices clearing support levels at 122.94 and 122.80 first.
Written By: Mahmoud Alkudsi
Please feel free to contact me on Twitter: @Malkudsi
Having trouble with your trading strategy?Heres the #1 mistake that traders make
Disclaimer:
The views in this article only represent the author's personal views, and do not constitute investment advice on this platform. This platform does not guarantee the accuracy, completeness and timeliness of the information in the article, and will not be liable for any loss caused by the use of or reliance on the information in the article.
WikiFX Broker
Latest News
Good News Malaysia: Ready for 5% GDP Growth in 2025!
How to Automate Forex and Crypto Trading for Better Profits
Is the stronger dollar a threat to oil prices?
Rising Risk of Japan Intervening in the Yen's Exchange Rate
How Far Will the Bond Market Decline?
U.S. to Auction $6.5 Billion in Bitcoin in 2025
Standard Chartered Secures EU Crypto License in Luxembourg
Trading Lessons Inspired by Squid Game
Is Infinox a Safe Broker?
How Did the Dollar Become the "Dominant Currency"?
Currency Calculator


