简体中文
繁體中文
English
Pусский
日本語
ภาษาไทย
Tiếng Việt
Bahasa Indonesia
Español
हिन्दी
Filippiiniläinen
Français
Deutsch
Português
Türkçe
한국어
العربية
Gold Price Rebound Under Threat, Silver Battles Conflicting Signals
Abstract:Gold and silver continue to draw attention with both now looking for their next move after Fridays price action. There is a lot of potential risk events this week – will that boost the pair?
Gold and Silver Price Analysis and Charts.
Golds recent pull-back has come to a halt ahead of a week packed full of risk events.
Silver caught between trend and 200-day moving average.
DailyFX Q2 Forecasts and Top 2019 Trading Opportunities.
Gold Fades Lower but Risk Lies Ahead
Gold sits just above an important support zone as it tries to keep gains made last week. While the short-term chart pattern remains bearish, with lower highs and lower lows seen since February 20, the week is full of high-risk events and data releases which may help to underpin gold at its current levels.
Gold Price Outlook: A Week Packed Full of Major Risk Events and Data
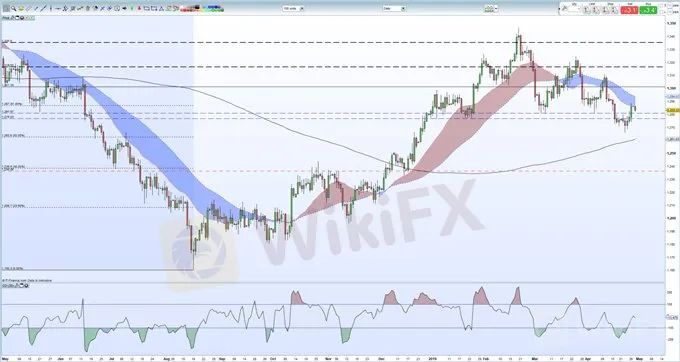
The daily chart shows gold nearing the $1,276 - $1,281/oz zone that acted as minor resistance last week. The upper band of this zone should now act as first, minor, support before $1,276/oz and $1,266/oz come into play. To the upside, 61.8% Fibonacci retracement at $1,287/oz is the first target for bullish traders followed shortly after by $1,289/oz. The CCI indicator shows gold mid-market, neither overbought or oversold.
Gold Daily Price Chart (May 2018 – April 29, 2019)

Trading the Gold-Silver Ratio: Strategies and Tips.
IG Client Sentimentshows that retail traders are 73.0% net-long gold, a bearish contrarian indicator. However, recent daily and weekly sentiment shifts suggest that the current gold trend may reverse higher.
Silver – 200-DMA Battles Bearish Bias.
Silver remains just above $15.03/oz with minor support seen at the physiological $15.00/oz before slightly more meaningful support from the 200-day moving average, currently at $14.97/oz. The longer-dated ma has provoked supportive price in the last month and may turn to resistance if a fresh break and close below occurs. Below here 23.6% Fibonacci retracement at $14.91/oz. Silver has broken – is currently trading above – the downtrend line based off the February 20 high, and a clean break and close above may bring open the way to $15.09 - $15.11/oz in the short-term. The last swing high at $15.34/oz remains the next target.
How to Trade Silver: Top Silver Trading Strategies.
Silver Daily Price Chart (August 2018 – April 29, 2019)

IG Client Sentiment shows how retail traders are positioned in a wide range of currencies, commodities and cryptocurrencies. See how recent changes in positioning affect our trading bias.
--- Written by Nick Cawley, Market Analyst
To contact Nick, email him at nicholas.cawley@ig.com
Follow Nick on Twitter @nickcawley1
Disclaimer:
The views in this article only represent the author's personal views, and do not constitute investment advice on this platform. This platform does not guarantee the accuracy, completeness and timeliness of the information in the article, and will not be liable for any loss caused by the use of or reliance on the information in the article.
Read more

Gold Price Forecast
Bears waiting to target $1,700.

Gold Price Update
Gold Down, Investors Await Further Inflation Data

Gold Price, Silver Price Jump After Saudi Arabia Oil Field Attacks
Gold and silver turned sharply higher after the weekend‘s drone attacks on Saudi oil fields saw tensions in the area ratchet higher with US President Donald Trump warning Iran that he is ’locked and loaded.

Gold, Crude Oil Prices at Risk if ECB, US CPI Cool Stimulus Hopes
Gold and crude oil prices may be pressured if the ECB underwhelms investors dovish hopes while higher US core inflation cools Fed rate cut expectations.
WikiFX Broker
Latest News
Top 10 Trading Indicators Every Forex Trader Should Know
ASIC Sues Binance Australia Derivatives for Misclassifying Retail Clients
WikiFX Review: Is FxPro Reliable?
Malaysian-Thai Fraud Syndicate Dismantled, Millions in Losses Reported
Trading frauds topped the list of scams in India- Report Reveals
YAMARKETS' Jingle Bells Christmas Offer!
AIMS Broker Review
The Hidden Checklist: Five Unconventional Steps to Vet Your Broker
WikiFX Review: Something You Need to Know About Markets4you
Revolut Leads UK Neobanks in the Digital Banking Revolution
Currency Calculator


