简体中文
繁體中文
English
Pусский
日本語
ภาษาไทย
Tiếng Việt
Bahasa Indonesia
Español
हिन्दी
Filippiiniläinen
Français
Deutsch
Português
Türkçe
한국어
العربية
S&P 500, Nikkei 225 May Top as Samsung Sinks KOSPI. Markets Brace
Abstract:The Nikkei 225 formed a bearish reversal signal, dragged down by health-care stocks as Samsung Electronics sunk the KOSPI. Ahead, the S&P 500 may extend losses on US retail sales.
Asia Pacific markets slumped on Thursday, following Wall Street lower as US equities were dragged down by the health-care sector. Those concerns echoed into the Nikkei 225, as anticipated, where the Japanese index fell about 0.75%. Pharmaceuticals heavily underperformed, dragging down the index.
South Koreas KOSPI shed more than 1% of its value as it sunk with Samsung Electronics (a major component of the index). Reports crossed the wires that the new Galaxy Fold, a recently designed foldable phone set to be released on April 26, is breaking after just days of initial use.
Meanwhile, the Shanghai Composite declined more than 0.20% heading into the close as Australias benchmark ASX 200 was close to little changed. The latter is struggling to clear near-term resistance just under 6285.
US 2-year government bond prices rose, signaling risk aversion in the markets. The pro-risk New Zealand Dollar weakened across the board as the anti-risk Japanese Yen gained. AUD/USD was also somewhat negatively impacted, but a better-than-expected local jobs report stemmed losses.
S&P 500 futures are pointing notably lower, accompanied with bearish reversal signals. This hints that European and American financial markets may be in for a rough ride ahead. This may be exacerbated if US retail sales misses expectations, which has typically been the case with local data as of late.
Nikkei 225 Technical Analysis
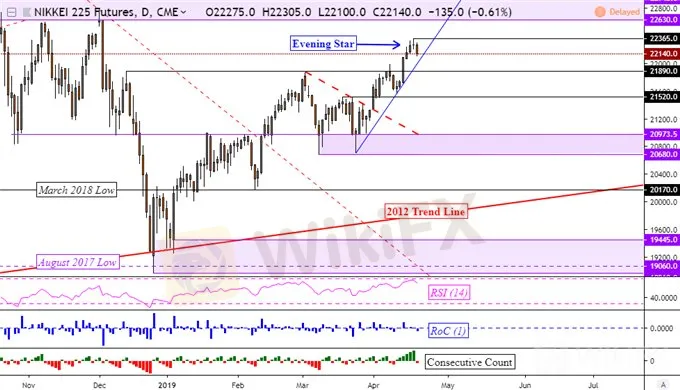
Looking at Nikkei 225 futures to show afterhours trade, the index has formed a bearish Evening Star candlestick pattern at the most recent peak. If there are to be losses ahead, keep a close eye on the rising support line from late March (blue line below). Clearing it may open the door to further losses.
Nikkei 225 Daily Chart

Chart Created in TradingView
Disclaimer:
The views in this article only represent the author's personal views, and do not constitute investment advice on this platform. This platform does not guarantee the accuracy, completeness and timeliness of the information in the article, and will not be liable for any loss caused by the use of or reliance on the information in the article.
Read more

Global Market Developments: Bond Market Interventions, Tech Stock Rebounds, and Rising Geopolitical Tensions
Global markets are navigating through significant shifts. China intervenes in the bond market to curb speculation, while Japan's Nikkei rebounds after historic losses. Elon Musk's increasing political involvement and General Motors' strategic shifts in China reflect broader economic and geopolitical trends. Rising tensions in the Middle East and U.S. labor market volatility add further complexity, influencing global currencies and stock movements.

Global Market Insights: Key Economic Events and Their Impact
Global Market Insights: Key Economic Events and Their Impact

Dow Jones, DAX 30, FTSE 100, S&P 500 Forecasts for the Week
The Dow Jones, DAX 30, FTSE 100 and S&P 500 may look to melt higher ahead of a monumental Fed meeting on Wednesday, but will past peaks look to rebuke a continuation higher?

S&P 500 Price Targets: SPX Consolidation Levels – Technical Trade Outlook
The S&P 500 remains within a broad consolidation level just below a key pivot zone weve been tracking for weeks. These are the levels that matter on the SPX500 charts.
WikiFX Broker
Latest News
High-Potential Investments: Top 10 Stocks to Watch in 2025
US Dollar Insights: Key FX Trends You Need to Know
Why Is Nvidia Making Headlines Everywhere Today?
Discover How Your Trading Personality Shapes Success
FINRA Charges UBS $1.1 Million for a Decade of False Trade Confirmations
Bitcoin in 2025: The Opportunities and Challenges Ahead
BI Apprehends Japanese Scam Leader in Manila
Big News! UK 30-Year Bond Yields Soar to 25-Year High!
SQUARED FINANCIAL: Your Friend or Foe?
Join the Event & Level Up Your Forex Journey
Currency Calculator


