简体中文
繁體中文
English
Pусский
日本語
ภาษาไทย
Tiếng Việt
Bahasa Indonesia
Español
हिन्दी
Filippiiniläinen
Français
Deutsch
Português
Türkçe
한국어
العربية
Dow Jones, DAX 30, FTSE 100, S&P 500 Forecasts for the Week
Abstract:The Dow Jones, DAX 30, FTSE 100 and S&P 500 may look to melt higher ahead of a monumental Fed meeting on Wednesday, but will past peaks look to rebuke a continuation higher?
Dow Jones, DAX 30, FTSE 100, S&P 500 Forecasts:
The Dow Jones and S&P 500 await a critical fundamental decision as they teeter narrowly beneath all-time highs
Elsewhere, the DAX 30 may look to consolidate after a nearly parabolic charge in September
Learn the different facts and opportunities when trading the Dow Jones, Nasdaq and S&P 500
Dow Jones,DAX 30, FTSE 100, S&P 500 Technical Outlook
The major stock indices saw a relatively uneventful week of price action as traders awaited crucial rate decisions from both the European Central Bank and the Federal Reserve. Despite the timid atmosphere, the Dow Jones, Nasdaq and S&P 500 were able to approach all-time highs. Not to be outdone, the DAX 30 is in the midst of a nearly parabolic climb and could soon target its own record levels. Meanwhile, the FTSE 100 languished about – comparatively - as Brexit uncertainty continues to keep the equity index in a chokehold.
Dow Jones Forecast
Outlook: Neutral
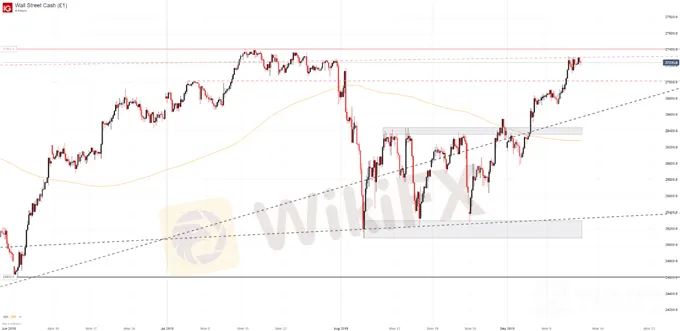
The Dow Jones Industrial Average tacked on further gains last week as it looks to probe record levels around 27,400. Before it can test all-time highs, however, the DJIA must surmount resistance posed by the trendline from January 2018. While it may not possess the technical influence to stall price in the event of a serious fundamental development, it could look to cap gains on an intraday basis.
Dow Jones Price Chart: 4 – Hour Time Frame (June – September) (Chart 1)

Day Trading the Dow Jones: Strategies, Tips & Trading Signals
Conversely, the Dow will look to horizontal support around 27,000 before turning to the upper bound of the August range at roughly 26,400 in the event of a bearish continuation. The ascending trendline marked by December and June lows may come into play prior, but the degree to which it was disregarded in August calls the levels technical merit into question.
DAX 30 Forecast
Outlook: Consolidation Needed
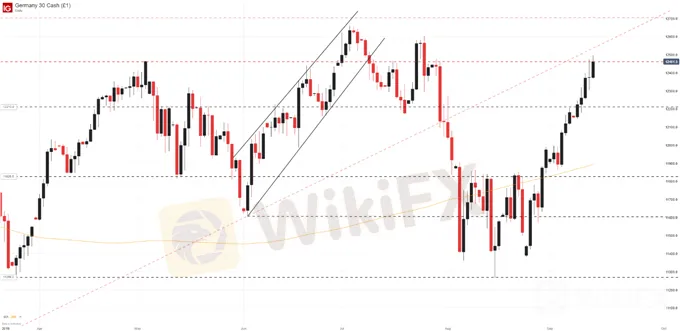
The DAX 30 has staged an incredible rally in late August and September, climbing over 9% since its August 15 low. With a willing fundamental backdrop, the rally may look to continue but could be due for a brief period of consolidation to allow bulls to catch their breath. That said, support around the 12,200 level could be an initial level to watch in the event of a modest pullback.
DAX 30 Price Chart: Daily Time Frame (April – September) (Chart 2)

How to Trade the Dax 30: Trading Strategies and Tips
On the other hand, if consolidation fails to materialize, resistance to a continuation higher will reside around the 12,460 level – coinciding with prior highs and Fridays daily close. Secondary resistance may be offered by the ascending trendline from December and June around 12,550.
FTSE 100 Forecast
Outlook: Neutral
Although it has enjoyed gains of its own, the FTSE 100 largely lags the Dow Jones and DAX. Nevertheless, the Index climbed modestly last week until it was stalled by Fibonacci resistance on Friday around the 7,368 level. In the week ahead, the Fib level will pose initial resistance before the ascending trendline around 7,470 can be targeted. Support will be marked by the 200-day moving average slightly beneath 7,300 and by the Fibonacci level around 7,200.
FTSE 100 Price Chart: Daily Time Frame (June – September) (Chart 3)

S&P 500 Forecast
Outlook: Neutral
Unlike the other indices, the S&P 500 has little resistance between Fridays trading price and all-time highs around 3,028. Viewed by many as the benchmark for speculative appetite, its presence near record levels bodes well for the other indices that are attempting to establish gains of their own. As bulls look to claim fresh all-time highs, support could look to play a crucial role in keeping the Index afloat in the interim.
S&P 500 Price Chart: 4 – Hour Time Frame (June – September) (Chart 2)

How to Trade the S&P 500: Strategies, Tips and Trading Hours
As with many of the other technical landscapes, the ascending trendline from December and June lows will look to offer buoyancy slightly above the 3,000 level where psychological support resides. Subsequent support may be offered by the ascending trendline from August lows and the upper-bound of the recent range in the 2,945 zone. As traders await key fundamental developments scheduled in the week ahead, be sure to follow @PeterHanksFX on Twitter for updates and analysis.
Disclaimer:
The views in this article only represent the author's personal views, and do not constitute investment advice on this platform. This platform does not guarantee the accuracy, completeness and timeliness of the information in the article, and will not be liable for any loss caused by the use of or reliance on the information in the article.
Read more

Gold Price Forecast: XAU/USD surges above $1,800 on falling US T-bond yields
Gold advances firmly, as US-10 year T-bond yields drop ten basis points, down to 1.43%. Risk-off market sentiment boosted the prospects of the XAU/USD, as the COVID-19 omicron variant threatens to derail the economic growth. XAU/USD Technical outlook: A break above $1,807 would expose $1,815, followed by $1,834.

Nasdaq 100 Price Forecast: Index Retakes September Peaks but Gaps Loom
The Nasdaq 100 climbed higher on Wednesday to cement its status above the peaks from September 2018. Looking ahead, a continuation higher seems possible, but open air beneath looms large.

S&P 500 Price Targets: SPX Consolidation Levels – Technical Trade Outlook
The S&P 500 remains within a broad consolidation level just below a key pivot zone weve been tracking for weeks. These are the levels that matter on the SPX500 charts.

Dow Jones Forecast: TGT, LOW Earnings Expected to Highlight Trade Wars
After Home Depot (HD) delivered robust second quarter results despite trade war headwinds, the table is set for Lowes (LOW) and Target (TGT) to follow suit.
WikiFX Broker
Latest News
ASIC Sues Binance Australia Derivatives for Misclassifying Retail Clients
WikiFX Review: Is FxPro Reliable?
Malaysian-Thai Fraud Syndicate Dismantled, Millions in Losses Reported
Trading frauds topped the list of scams in India- Report Reveals
AIMS Broker Review
The Hidden Checklist: Five Unconventional Steps to Vet Your Broker
YAMARKETS' Jingle Bells Christmas Offer!
Revolut Leads UK Neobanks in the Digital Banking Revolution
Fusion Markets: Safe Choice or Scam to Avoid?
SEC Approves Hashdex and Franklin Crypto ETFs on Nasdaq
Currency Calculator


