简体中文
繁體中文
English
Pусский
日本語
ภาษาไทย
Tiếng Việt
Bahasa Indonesia
Español
हिन्दी
Filippiiniläinen
Français
Deutsch
Português
Türkçe
한국어
العربية
Crude Oil Price Under Threat on Potential End to OPEC Supply Cuts
Abstract:West Texas Intermediate Crude oil touched $63.15 on Monday, the lowest level since April 5 as a Russian official questioned the adverse impact to their market share from OPEC+ orchestrated cuts.
Crude Oil Price Under Threat on Potential End to OPEC Supply Cuts
Crude oil retreated to around $63.40 on Monday after climbing to the highest price in five months last week - around $64.50. Crude oils outlook is clouded by a series of supply-side uncertainties alongside global growth concerns that could weigh on demand forecasts.
Oil-producers Libya and Venezuela remain in states of crisis which has called their output consistency into question. Perhaps a more immediate driver behind Monday‘s price decline was a report from Reuters regarding comments from a Russian official on the state of Russia’s crude oil market share.
On Saturday, Russian Finance Minister Anton Siluanov commented on Russias receding share within the crude oil market. “There is a dilemma. What should we do with OPEC: should we lose the market, which is being occupied by the Americans, or quit the deal?” he said in Washington. If Russia were to cast aside OPEC output constraints in favor of recapturing lost market share, crude could see its recent rally threatened. The current 1.2 million barrel per day cut was enacted in January and is slated to remain in place for six months. OPEC and OPEC+ members will meet on June 25 and 26 to discuss an extension to the cuts.
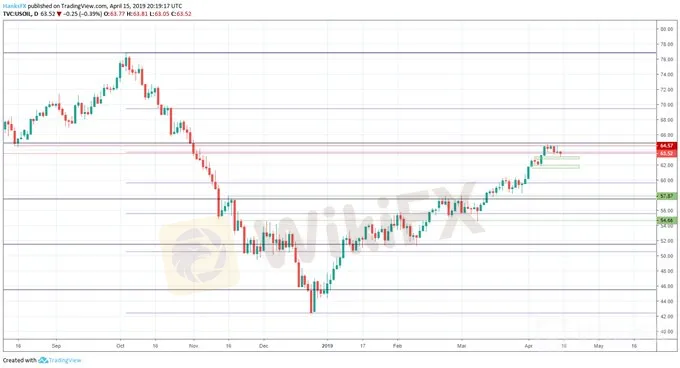
Crude Oil Price Chart: Daily Time Frame (August 2018 – April 2019) (Chart 1)

From a technical perspective, crude oil trades slightly beneath the 61.8% Fib level from October‘s highs to December’s lows in 2018. Above that exists horizontal resistance from Augusts swing low, with the 23.6% Fib level from February 2016 to October 2018 to the topside.
Intraday trading saw crude slip beneath the 61.8% level early on and was unable to breakthrough on multiple retests as the session progressed. For support, the $63.11 to $62.82 area will offer buoyancy should the commodity experience further pressure in the week ahead. Similarly, $62 to $61.60 will likely mark an area of subsequent support.
Crude Oil Price Chart: 1 – Hour Time Frame (March 2019 – April 2019) (Chart 2)

With the next OPEC meeting still months away, crude traders should look to Chinese GDP on Wednesday to help gauge the degree of demand for the fossil fuel. Baker Hughes rig count data is due Thursday, which will also offer short-term influence on crude oils price.
Disclaimer:
The views in this article only represent the author's personal views, and do not constitute investment advice on this platform. This platform does not guarantee the accuracy, completeness and timeliness of the information in the article, and will not be liable for any loss caused by the use of or reliance on the information in the article.
WikiFX Broker
Latest News
Pepperstone Sponsored the "Aston Martin Aramco Formula One Team"
SQUARED FINANCIAL: Your Friend or Foe?
Big News! UK 30-Year Bond Yields Soar to 25-Year High!
ACY Securities Integrates MetaTrader 5 to Enhnace Copy Trading Service
Soegee Futures Review: Should You Trust This Broker?
Malaysian Pilot Loses RM1.36 Million in UVKXE Investment App Scam
Indonesia officially joins the BRICS countries
Attention! Goldman Sachs Cuts Gold Target to $2910
Inflation Rebounds: ECB's Big Rate Cut Now Unlikely
Carney \considering\ entering race to replace Canada\s Trudeau
Currency Calculator


