简体中文
繁體中文
English
Pусский
日本語
ภาษาไทย
Tiếng Việt
Bahasa Indonesia
Español
हिन्दी
Filippiiniläinen
Français
Deutsch
Português
Türkçe
한국어
العربية
S&P 500 Trading Volume: A Black Hole Around Fed Minutes
Abstract:A recent lack of trading volume may be set to end with event risk from the central bank double-header in the rearview and earnings season on tap.
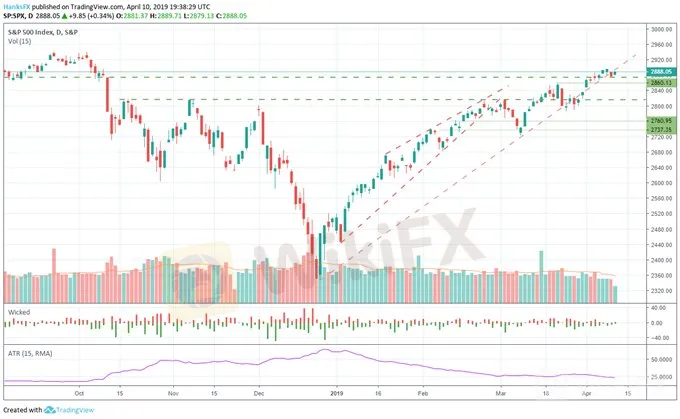
S&P 500 trading volume slipped into a black hole ahead of Wednesday‘s FOMC meeting minutes as traders saw little cause to weather the event risk. April alone has delivered 5 of the index’s 6 lowest volume trading sessions, and volumes moving average has slipped to its lowest level since late September 2018.
S&P 500 Price Chart: Daily Time Frame (September 2018 - April 2019) (Chart 1)

Similarly, the indexs average true range has fallen alongside volume. That said, traders are oft reluctant to risk exposure during Fed meetings. In the following days of an event, average volume is frequently heightened, and the highs are astronomical – suggesting traders are coping with a notably revised policy outlook.
S&P Trading Volume and the Fed (Chart 2)

Data compiled from Bloomberg
Despite Thursdays sparse economic calendar, volume should pick up – albeit not to the same degree given the uneventful minutes release. With event risk in the rear-view, traders can look to the future and position for earnings season and the implications from an announcement from US Treasury Secretary Steven Mnuchin on trade war progress.
S&P 500 Price Chart: 1 – Hour Time Frame (March 24 – April 10) (Chart 3)

As for the technical perspective of the index, it trades narrowly beneath trendline resistance from late December. Although the line has been subject to breaks, it continues to influence price action. Conversely, the S&P 500 has horizontal trendline support from the high of February 2018 beneath it at 2875. With earnings on the horizon, IG clients have only increased their short exposure.

Retail trader data shows 24.8% of traders are net-long with the ratio of traders short to long at 3.04 to 1. Since we typically take a contrarian view to crowd sentiment, the fact that retail traders are overwhelmingly short suggests the S&P 500 may continue its recent trend.
Disclaimer:
The views in this article only represent the author's personal views, and do not constitute investment advice on this platform. This platform does not guarantee the accuracy, completeness and timeliness of the information in the article, and will not be liable for any loss caused by the use of or reliance on the information in the article.
Read more

S&P 500 Price Outlook: Value Stocks Outperform Momentum, Tech Lags
After breaking outside of its August range, the road higher seemed to be laid out for the S&P 500, but tech and momentum stocks have been largely absent from the rally effort.

S&P 500 Forecast: Stocks Threaten Breakdown as TLT ETF Soars
The S&P 500 fluctuated between losses and gains on Thursday before finishing narrowly higher. Meanwhile, investors continued to clamor for safety in bonds.

Dow Jones, DAX 30, FTSE 100 Forecasts for the Week Ahead
As trade wars and monetary policy look to maintain their position at the helm, markets will be offered insight on another major theme that could rattle fragile sentiment.

S&P 500 Forecast: Stocks Rebound, but will the Recovery Continue?
After plummeting at the open, the S&P 500 mounted a relief effort during Wednesday trading to eventually close in the green. While the rebound was encouraging, can it surmount nearby resistance?
WikiFX Broker
Latest News
SQUARED FINANCIAL: Your Friend or Foe?
Big News! UK 30-Year Bond Yields Soar to 25-Year High!
High-Potential Investments: Top 10 Stocks to Watch in 2025
Why Is Nvidia Making Headlines Everywhere Today?
Discover How Your Trading Personality Shapes Success
US Dollar Insights: Key FX Trends You Need to Know
FINRA Charges UBS $1.1 Million for a Decade of False Trade Confirmations
BI Apprehends Japanese Scam Leader in Manila
Bitcoin in 2025: The Opportunities and Challenges Ahead
Join the Event & Level Up Your Forex Journey
Currency Calculator


