简体中文
繁體中文
English
Pусский
日本語
ภาษาไทย
Tiếng Việt
Bahasa Indonesia
Español
हिन्दी
Filippiiniläinen
Français
Deutsch
Português
Türkçe
한국어
العربية
US Dollar Price Action Setups: EUR/USD, USD/JPY and USD/CHF
Abstract:The US Dollar continues to work within the longer-term ascending triangle. But bulls have retained control into Q2, and tomorrow brings NFP. Might a break be near?
US Dollar Talking Points:
美元谈话要点:
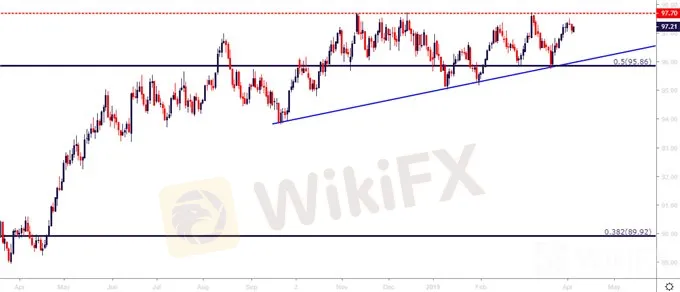
- The US Dollar continues to trade within the confines of previously established support and resistance, with buyers showing up around the 97.00 level yesterday to pose another topside push up to near-term resistance around 97.21-97.30. This extends a pattern of digestion that‘s been showing in varying forms since November of last year. Tomorrow’s economic calendar brings March Non-Farm Payroll numbers: Will this be the driver that finally helps the US Dollar test the topside of the brewing ascending triangle formation?
- 美元继续在先前确定的支撑和阻力范围内交易,昨日买家显示在97.00附近在97.21-97.30附近构成另一个上行推动近期阻力。这延续了自去年11月以来以不同形式呈现的消化模式。明天的经济日历会带来三月非农就业数据:这会成为最终帮助美元测试酿造上升三角形的顶部的驱动因素吗?
- Given the lack of long-term trends in USD, a number of potential breakout scenarios are present in major pairs such as USD/JPY and EUR/USD. USD/CHF, on the other hand, may be showing a potential trend setup that could remain of interest for those looking at strategies of USD-weakness ahead of or around tomorrows NFP report.
- 鉴于缺乏美元的长期趋势,美元/日元和欧元/美元等主要货币对出现了许多潜在的突破情景。另一方面,美元/瑞士法郎可能正在显示一个潜在的趋势设置,对于那些在明天NFP报告之前或之前寻找美元疲软策略的人来说可能仍然感兴趣。
US Dollar Churns into NFP
美元兑换成NFP
The first week of Q2 is almost complete; and much as FX markets have become accustomed to, the US Dollar has continued to show digestion as prices work deeper within an ascending triangle formation. As looked at in the Q2 Technical Forecast for the US Dollar, this is a pattern that will often be approached in a bullish manner – looking for the same enthusiasm thats driven bulls in at higher-lows to, eventually, take over to allow for a breakout at horizontal resistance.
第二季度的第一周即将完成;正如外汇市场已经习以为常,美元继续呈现消化状态,因为价格在上升的三角形形态中更深入。正如在第二季度美元技术预测中所看到的那样,这种模式通常会以看涨的方式接近 - 寻找同样的热情,这些热情推动多头处于较高低点,最终接管以允许水平阻力突破。
Access the DailyFX Q2 Forecasts for USD, Euro, GBP and More
获取美元,欧元,英镑等更多的DailyFX Q2预测
US Dollar Daily Price Chart
美元每日价格走势图

Chart prepared by James Stanley
詹姆斯·斯坦利编制的图表
At this point, the devils is in the details as prices in USD have been adhering to previously established support and resistance levels inside of that longer-term ascending triangle. Yesterday saw a bounce off of a familiar zone around 97.00; and thats led into a push up to 97.21-97.30.
此时,由于美元价格一直坚持以前建立的支撑位和阻力位,因此细节处于细节之中这个长期上升的三角形。昨天看到一个熟悉的区域在97.00左右反弹;这导致了97.21-97.30的推升。
This doesnt make for much excitement around USD price action at the moment, but the big question is whether markets may be on the cusp of a breakout that could do away with that recent impasse. Tomorrow brings Non-Farm Payrolls out of the Untied States, and last months release of this data point brought upon almost two weeks of weakness in the Greenback. This is around the time DXY folded after failing to breakout at the resistance side of that ascending triangle. That led into almost two weeks of weakness as prices traversed the entirety of the formation – eventually finding support around the bullish trend-line just after the March FOMC rate decision.
目前美元价格走势并不令人兴奋,但最大的问题是市场是否会出现在市场上突破的尖点可以消除最近的僵局。明天将非农就业人口从美国带回来,上个月发布的这一数据点导致美元近两周的疲软。这是在DXY在该上升三角形的阻力位未能突破后折叠的时间。由于价格遍及整个形态,这导致近两周的疲软 - 最终在3月FOMC利率决定之后在看涨趋势线附近获得支撑。
Will tomorrow bring that breakout around NFP after a very different outcome last month?
明天将带来在上个月发生了截然不同的结果后,全国民主党的突破是什么?
US Dollar Four-Hour Price Chart
美元四小时价格图表

Chart prepared by James Stanley
詹姆斯·斯坦利编制的图表
EURUSD Re-Buffed At Range Support
欧元兑美元在支撑范围内再次受到支撑
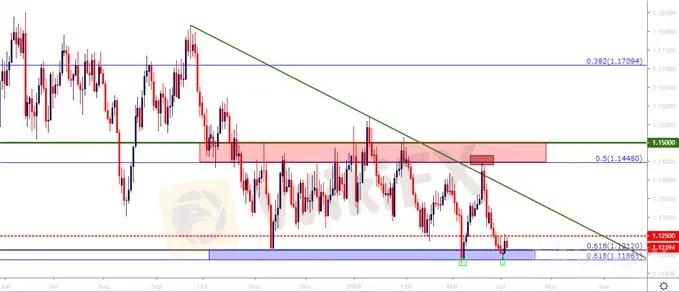
Going along with that theme of potential strength in the US Dollar is a backdrop of bearish breakout potential around EURUSD. Similar to the US Dollar above, EURUSD has been building into a range formation since last November; and this has held through a variety of fundamental events. The pair has continued to find support around two key Fibonacci levels: At 1.1212 is the 61.8% retracement of the ‘lifetime move’ in EURUSD, and just below that at 1.1187 is the 61.8% retracement of the 2017-2018 bullish move in the pair.
同时讨论美元潜在强势的主题欧元兑美元附近出现看跌突破的背景。与上述美元类似,自去年11月以来,欧元兑美元已经形成范围;这已经贯穿了各种基本事件。该货币对继续在两个关键的斐波那契水平附近找到支撑位:1.1212是“终生移动”的61.8%回撤位在欧元兑美元中,正好在1.1187下方是2017 - 2018年该货币对看涨的61.8%回撤位。
The latter of those levels has already come into play in the opening days of Q2, as a quick push down to support was soundly re-buffed by buyers; although this may be more of an element of short-cover as the pair re-encountered a big support area that led to a strong reversal last month. As looked at yesterday, prices in the pair trickled all the way up to the 1.1250 psychological level, at which point sellers came back-in to temper the highs.
这些水平的后者已经在第二季度的开放日,由于买家的声音得到了重新缓解,因此快速下调支持;虽然这可能更多是空头回补的因素,因为该货币对再次遇到一个大支撑区域,导致上个月出现强烈逆转。正如昨天看到的那样,价格一路飙升至1.1250的心理水平,此时卖家重新回到了高点。
EURUSD Four-Hour Price Chart
EURUSD四小时价格图表

Chart prepared by James Stanley
James Stanley编制的图表
The big question around EURUSD is connected to the similar theme in USD: Can bears finally pose a break of range support, which would go along with a topside break of the US Dollar‘s ascending triangle? Tomorrow’s NFP report could provide catalyst for such a move.
围绕EURUSD的重大问题与美元:空头能否最终突破区间支撑位,这将伴随着美元上行三角形的上行突破?明天的非农就业报告可以为这一举动提供催化剂。
EURUSD Daily Price Chart
EURUSD每日价格图表

Chart prepared by James Stanley
James Stanley编制的图表
{777}
USDJPY Tests Trend-line Resistance as Risk Appetite Returns
{777}
The March FOMC rate decision was interesting on a number of levels: The FOMC cut rate forecasts for 2019, previously looking at two hikes and now looking at zero. This would normally be music to the ears of risk-bulls; but matters didn‘t exactly play out like that. In the aftermath of that rate decision, risk aversion began to show, perhaps as a signal of fear from the Fed’s flip. In short-order, the US Yield curve showed inversion as the 3-month Treasury Bill yielded more than the 10-Year Treasure Note; an observation that hadnt been seen since 2007, just before the financial collapse.
3月FOMC利率决定在多个层面上都很有趣:FOMC对2019年的降息预测看着两个徒步旅行,现在看着零。这通常是风险公牛耳中的音乐;但问题并没有完全像那样。在该利率决定之后,风险规避开始显现,可能是美联储贬值的恐惧信号。在短期内,美国收益率曲线显示反转,因为3个月的国库券收益超过10年期国债; jus,自2007年以来一直未见过的观察结果在金融崩溃之前。
Also notable was the re-appearance of Yen-strength. USDJPY had spent much of Q1 recovering from a nasty spill in the opening days of 2019. That bullish backdrop remained for most of the period, until that FOMC rate decision, at which point prices broke-down to a prior support level around 109.67-110.00.
同样值得注意的是日元强势的再次出现。在2019年的开盘日,美元兑日元在第一季度的大部分时间内从一次恶劣的泄漏中恢复过来。在此期间的大部分时间里仍然存在看涨背景,直到FOMC利率决定,此时价格跌至109.67-110.00之前的支撑位。 。{/}
But – that support has held the lows, and as the risk-on market mode has returned with a more dovish Fed in the backdrop, prices in USD/JPY have re-ascending back-above the 110.00 level.
但是 - 这种支撑位居低位,随着市场风险模式的回归,美联储在更加温和的背景下,美元/日元的价格重新回归升至回升至110.00水平之上。
At this point, USDJPY is testing resistance at a descending trend-line taken from the March swing-highs. This can set the pair up for scenarios in either direction: For traders looking at the risk-off theme, theres an abundance of resistance points sitting above current price that can be used for reversal scenarios. For bulls looking at long exposure in USD or bearish exposure in JPY, those same points of resistance can be incorporated for breakout strategies, targeting a test of the 112.34 Fibonacci level.
此时,美元兑日元正在测试阻力位于3月摆动高点的下行趋势线上。这可以为两个方向的情景设置对:对于看风险主题的交易者而言,当前价格上方存在大量可用于逆转情景的阻力点。对于考虑美元长期风险或日元看跌风险的多头,可以将这些相同的阻力点纳入突破策略,目标是测试112.34斐波纳契水平。
USDJPY Four-Hour Price Chart
USDJPY Four -Hour Price Chart

Chart prepared by James Stanley
James Stanley编制的图表
USDCHF Moves Back Towards Resistance Zone
美元兑瑞郎回到阻力区
While short-side USD strategies in EURUSD may be lacking interest because, well, that would require one to be long Euro; the short-side of USD/CHF may hold some attraction going into tomorrow‘s FOMC rate decision. The pair found support at a key Fibonacci level in the waning days of March, and prices have been moving higher in an almost begrudging fashion since. An area of resistance around the parity level came into play on Tuesday, and that’s holding the Q2 highs for now. But, if sellers come back in to show continued respect of this level, particularly if this comes with a lower-high, the door can remain open for short-side strategies, looking for a revisit of the Fibonacci level around .9902.
虽然欧元兑美元的短期美元策略可能缺乏兴趣,因为这需要一个长欧元;美元/瑞士法郎的空头可能会对明天的FOMC利率决定产生一些吸引力。在3月份的衰退时期,该货币对在一个关键的斐波那契水平获得支撑,此后价格一直在以一种近乎吝啬的方式走高。平价水平附近的阻力区域在周二开始发挥作用,目前处于第二季度高位。但是,如果卖家回来表示继续尊重这个级别,特别是如果这是一个较低的高,门可以保持打开或短边策略,寻找对.9902附近的斐波纳契水平的重访。
USDCHF Four-Hour Price Chart
USDCHF四小时价格图表

Chart prepared by James Stanley
图表由詹姆斯·斯坦利编写
Disclaimer:
The views in this article only represent the author's personal views, and do not constitute investment advice on this platform. This platform does not guarantee the accuracy, completeness and timeliness of the information in the article, and will not be liable for any loss caused by the use of or reliance on the information in the article.
WikiFX Broker
Latest News
Revolut X Expands Crypto Exchange Across Europe, Targeting Pro Traders
Broker Review: Is Exnova Legit?
Capital.com Shifts to Regional Leadership as CEO Kypros Zoumidou Steps Down
Crypto Scammer Pleads Guilty in $73 Million “Pig Butchering” Fraud
CWG Markets Got FSCA, South Africa Authorisation
Amazon launches Temu and Shein rival with \crazy low\ prices
CySEC Warns Against Unauthorized Investment Firms in Cyprus
Why Even the Highly Educated Fall Victim to Investment Scams?
Warning Against Globalmarketsbull & Cryptclubmarket
FBI Raids Polymarket CEO’s Home Amid 2024 Election Bet Probe
Currency Calculator


