简体中文
繁體中文
English
Pусский
日本語
ภาษาไทย
Tiếng Việt
Bahasa Indonesia
Español
हिन्दी
Filippiiniläinen
Français
Deutsch
Português
Türkçe
한국어
العربية
Crude Oil Prices May Validate Bearish Chart Cues on Growth Fears
Abstract:Crude oil prices may validate technical positioning hinting that a top is taking shape as worries about slowing global growth stoke market-wide risk aversion.
CRUDE OIL & GOLD TALKING POINTS:
Crude oil prices drop with stocks amid global slowdown fears
Gold prices up as yields decline, US Dollar bounce caps rise
S&P 500 futures suggest risk aversion has scope to continue
Sentiment-sensitive crude oil prices fell alongside stocks on Friday as disappointing PMI data fueled global slowdown fears and stocked risk aversion, as expected. Gold prices managed a tepid rise as bond yields fell, boosting the relative appeal of non-interest-bearing assets. Upside progression was capped as haven-seeking flows buoyed the US Dollar however.
CRUDE OIL PRICES MAY FALL AMID RISK AVERSION
Looking ahead, a muted offering on the economic data docket seems likely to keep the trajectory of broad-based risk appetite as the main driver for price action. Bellwether S&P 500 futures are tellingly pointing lower, suggesting Fridays risk-off tilt is likely to remain in place. That bodes ill for oil prices. Meanwhile, gold will probably continue to weigh competing influences from bond yields and the Greenback.
Learn what other traders gold buy/sell decisions say about the price trend!
GOLD TECHNICAL ANALYSIS
Gold prices still look to be carving out a somewhat choppy Head and Shoulders top, but confirmation remains absent. Completing the pattern would require a reversal back below the 1303.70-09.12 area, followed by a breach of neckline support at 1282.05. Alternatively, a move above near-term resistance at 1326.30 sets the stage for a retest of the February top at 1346.75.
CRUDE OIL TECHNICAL ANALYSIS
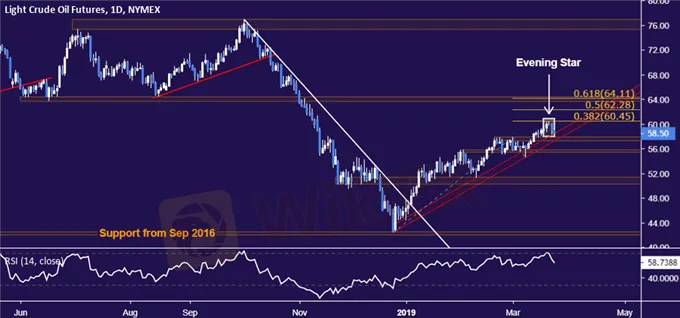
Crude oil prices may be signaling a top with the formation of a bearish Evening Star candlestick pattern. A daily close below initial support in the 57.24-88 area would confirm the setup, initially exposing the 55.37-75 zone next. Alternatively, a push above resistance marked by the 38.2% Fibonacci expansion at 60.45targets the 50% level at 62.28.

Disclaimer:
The views in this article only represent the author's personal views, and do not constitute investment advice on this platform. This platform does not guarantee the accuracy, completeness and timeliness of the information in the article, and will not be liable for any loss caused by the use of or reliance on the information in the article.
Read more

KVB Today's Analysis: USD/JPY Eyes Volatility Ahead of BoJ Policy Meeting and US Data
The USD/JPY pair rises to 154.35 during the Asian session as the Yen strengthens against the Dollar for the fourth consecutive session, nearing a 12-week high. This is due to traders unwinding carry trades ahead of the Bank of Japan's expected rate hike and bond purchase tapering. Recent strong US PMI data supports the Federal Reserve's restrictive policy. Investors await US GDP and PCE inflation data, indicating potential volatility ahead of key central bank events.

Today's analysis: USDJPY Poised for Increase Amid Bank of Japan's Strategy
The USD/JPY is expected to rise. The Bank of Japan will keep interest rates between 0 and 0.1% and continue its bond purchase plan but may reduce purchases and raise rates in July based on economic data. Technically, the pair is trending upward with resistance at $158.25 and $158.44, and support at $157.00, $156.16, and $155.93.

March 21, 2024 DAILY MARKET NEWSLETTER: Fed Hints at Rate Cuts, Stocks Surge
Consider including the date in your title for clarity.

Daily Market Newsletter - March 12, 2024: Market Recap: S&P 500 and Nasdaq Decline, Bitcoin Boosts Microstrategy to Record Highs
Insights from Trading Central's Global Research Desks
WikiFX Broker
Latest News
BSP Shuts Down Uno Forex Over Serious AML Violations
ACY Securities Expands Global Footprint with South Africa Acquisition
Tokyo Police Arrest 4 for Unregistered FX Trading Scheme
Rupee gains against Euro
WikiEXPO Global Expert Interview: The Future of Financial Regulation and Compliance
DFSA Warns of Fake Loan Approval Scam Using Its Logo
Consob Sounds Alarm: WhatsApp & Telegram Users Vulnerable to Investment Scams
CySEC Revokes UFX Broker Licence as Reliantco Halts Global Operations
Bitcoin ETF Options Get Closer to Reality with CFTC Clarification
US Regulators Tighten Oversight on Bank Anti-Money Laundering Efforts
Currency Calculator


