简体中文
繁體中文
English
Pусский
日本語
ภาษาไทย
Tiếng Việt
Bahasa Indonesia
Español
हिन्दी
Filippiiniläinen
Français
Deutsch
Português
Türkçe
한국어
العربية
Sterling (GBP): PM May Has 12 Days or Parliament May Take Over Brexit
Abstract:The Brexit timetable was left unchanged after yesterdays votes in the House of Commons and PM May now has until February 27 to get a
Brexit Latest: News, Updates and Sterling Technical Analysi
Amendments defeated in Parliament as expected.
Sterling slips but rolls with the punches.
We have recently released our Q1 2019 Trading Forecasts for a wide range of Currencies and Commodities, including GBPUSD along with our latest fundamental and medium-term term technical outlook.
Sterling (GBP): Support Being Eroded
Thursdays votes in the House of Commons were defeated as had been fully expected, adding to the pressure on PM May to get a workable deal with the EU in the next two weeks. If, as seems likely, she is unable to get the guarantee from the EU on the Irish backstop that she has been demanding, it is likely that Parliament will take control of the process. While this uncertainty may weigh on Sterling in the near-term, if Parliament takes over, it is very likely that Brexit negotiations will be extended for a few months and, more importantly for the Pound, the No Deal option will be taken off the table.
The worry for Sterling is that the main bill – approving the PMs Brexit strategy - was defeated again last night after Conservative Eurosceptics abstained from voting with the PM as they feared that this would lead to the No Deal option being taken off the negotiating table.
Brexit and the Pound: Why EU Might Spurn a Last-Minute Deal With the UK.
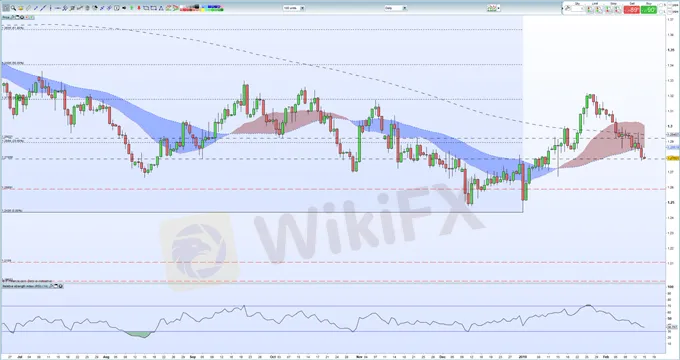
Against this increasingly time sensitive backdrop, Sterling remains relatively stable, edging slightly lower before slowly pulling back some of its losses. This slow drip lower over the last week has pushed GBPUSD under all three moving averages, a bearish set-up, and through 23.6% Fibonacci retracement at 1.2894. The old October 30 swing-low at just under 1.2700 is the next downside target, followed by the January 15 spike low at 1.2672. The RSI indicator has fallen to levels last seen in mid-December and is nearing oversold territory after being in overbought territory less than three weeks ago.
GBPUSD Daily Price Chart (June 2018– February 15, 2019)

IG Retail Sentimentdata shows clients are 70.2% net-long GBPUSD, a bearish contrarian indicator. Traders are further net-long than yesterday and last week, and the combination of current sentiment and recent changes gives us a stronger GBPUSD bearish contrarian trading bias.
DailyFX has a vast amount of resources to help traders make more informed decisions. These include a fully updated Economic Calendar, and a raft of constantly updated Educational and Trading Guide
Disclaimer:
The views in this article only represent the author's personal views, and do not constitute investment advice on this platform. This platform does not guarantee the accuracy, completeness and timeliness of the information in the article, and will not be liable for any loss caused by the use of or reliance on the information in the article.
Read more

GBP/USD (CABLE) 4Hour Anticipation
Daily wise bearish structure, but as 4H shown shift in structure to the topside

GBPUSD Price Rallies to a Six-Week High, Brexit Latest
GBPUSD has just hit its highest level since late-July and is eyeing further gains on a combination of a marginally stronger Sterling complex and a weak US dollar.

Sterling (GBP) Turnaround on Data Beat and Brexit Commentary - Webinar
After opening the session in negative territory, GBPUSD performed a quick U-turn after UK manufacturing, industrial production and monthly GDP data all beat expectations. And over in Ireland, UK PM Boris Johnson was in a more conciliatory mood.

US Dollar Reversal Continues: EUR/USD, GBP/USD, USD/CAD
The US Dollar came into the holiday-shortened week with a full head of steam. But that's been soundly reversed. Tomorrow brings NFP and Canadian employment.
WikiFX Broker
Latest News
Why is there so much exposure against PrimeX Capital?
Russia to Fully Ban Crypto Mining in 10 Regions Starting January 1, 2025
Two Californians Indicted for $22 Million Crypto and NFT Fraud
WikiFX Review: Is Ultima Markets Legit?
Colorado Duo Accused of $8M Investment Fraud Scheme
What Impact Does Japan’s Positive Output Gap Have on the Yen?
RM62k Lost Investment Scam After Joining XRP Community Malaysia on Telegram
Victims of Financial Fraud in France Suffer Annual Losses of at Least €500 Million
Malaysia Pioneers Zakat Payments with Cryptocurrencies
FCA's Warning to Brokers: Don't Ignore!
Currency Calculator


