简体中文
繁體中文
English
Pусский
日本語
ภาษาไทย
Tiếng Việt
Bahasa Indonesia
Español
हिन्दी
Filippiiniläinen
Français
Deutsch
Português
Türkçe
한국어
العربية
Friday Chart Tips
Abstract:Powered by WikiFX: (DXY, S&P, Nasdaq) Technical Analysis July 14 , 2023
CONFIRMATION OF INFLATION HITTING THE US DOLLAR HARD, LIFTING EQUITIES
The May inflation print revealed that core inflation had fallen below the previous sticky range of 5.4% - 5.7% for the first time, printing at 5.3%. However, it appears that markets have received more confirmation of the US disinflationary trend when June's core CPI data came in below the consensus forecast of 5%, eventually coming in at 4.8%. The headline measure, as well as the PPI, which was released ahead of the US open today, have been trending lower for some time.

TECHNICAL LEVELS IN THE S&P 500 TO CONSIDER
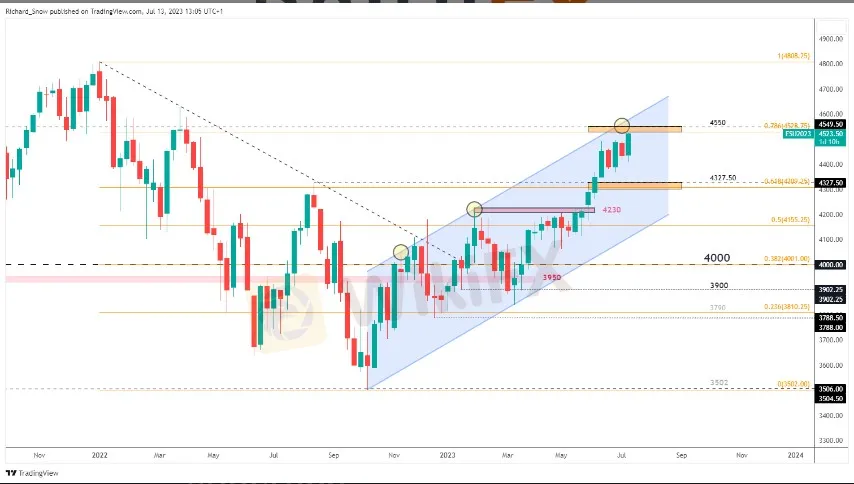
The S&P 500 (E-mini futures chart) suggests a higher open today, with the flagship US index poised to test resistance near 4528 (the 78.6% retracement of the 2022 major decline) and 4550. Pullbacks in the index have been difficult to come by, but prices have ended lower in two separate weeks. Bullish momentum accelerated after the declines, as bulls saw better entry points to resume the upward trend.

As prices edged higher yesterday only to close below 4510, the daily chart can help identify the new yearly high. Today, the futures market sees 4550 as the next level of resistance, with 4585 and 4630 following. Given the steady increase, support levels have become difficult to identify, but the swing low of 4411 is the most important level to monitor. For those expecting pullbacks soon, the RSI is just inches away from re-entering overbought territory.
The NASDAQ 100 index INTEREST LEVELS IN TECHNOLOGY

The Nasdaq, which has led the US equities race this year, is approaching a complete retracement of the major 2022 decline. What's more impressive is that this run has occurred during a year in which interest rates have continued to rise, albeit at a slower pace, thanks to a handful of megacap stocks and AI players.
The market appears motivated to reclaim all of the lost ground in 2022, as evidenced by a move above 15,260 and the 78.6% Fibonacci retracement of the 2022 decline. Weekly momentum appears to be strong, having remained overbought since the end of May. As long as prices stay within the ascending channel, the uptrend will continue.
On the daily chart, the move above what would have been considered a double top if prices had not rallied higher is clear. The September level of 15,710 is the next level of resistance, with 16,260 indicating near-term bullish fatigue. The index is on the verge of becoming overbought ahead of next week's start of tech earnings, which will be led by Tesla and Netflix after the major banks.


Disclaimer:
The views in this article only represent the author's personal views, and do not constitute investment advice on this platform. This platform does not guarantee the accuracy, completeness and timeliness of the information in the article, and will not be liable for any loss caused by the use of or reliance on the information in the article.
Read more

Trader Exposes Unethical Practices by STP Trading
A recent allegation against STP Trading has cast doubt on the firm's business practices, highlighting the potential risks faced by retail traders in an increasingly crowded and competitive market.

What Makes Cross-Border Payments Easier Than Ever?
Cross-border payments are now faster, cheaper, and simpler! Explore fintech, blockchain, and smart solutions to overcome costs, delays, and global payment hurdles.

WikiEXPO Dubai 2024 is set to open!
4 Days Left

Coinbase Under Scrutiny Amid Wrapped Bitcoin Delisting Controversy
Coinbase has come under fire after announcing its decision to delist Wrapped Bitcoin (wBTC), a move critics claim could be driven by competitive interests. The delisting, set to take effect on 19 December, has sparked allegations of market manipulation and concerns about fairness in the cryptocurrency ecosystem.
WikiFX Broker
Latest News
Webull Partners with Coinbase to Offer Crypto Futures
eToro Expands Nationwide Access with New York Launch
Why Is UK Inflation Rising Again Despite Recent Lows?
Hackers Charged for $11M Crypto Theft Using SIM-Swaps
Role of Central Banks in the FX Market
FCA Alerts Against Sydney FX
What Makes Cross-Border Payments Easier Than Ever?
Trader Exposes Unethical Practices by STP Trading
Interactive Brokers Launches Tax-Friendly PEA Accounts in France
Google Warns of New Deepfake Scams and Crypto Fraud
Currency Calculator


