简体中文
繁體中文
English
Pусский
日本語
ภาษาไทย
Tiếng Việt
Bahasa Indonesia
Español
हिन्दी
Filippiiniläinen
Français
Deutsch
Português
Türkçe
한국어
العربية
Technical Outlook for the Shanghai Composite Index: Is the Rally Losing Steam?
Abstract:Technical outlook for the shanghai composite index - Bullish

Chinese shares have encountered significant resistance, suggesting that the embryonic surge may be coming to an end.
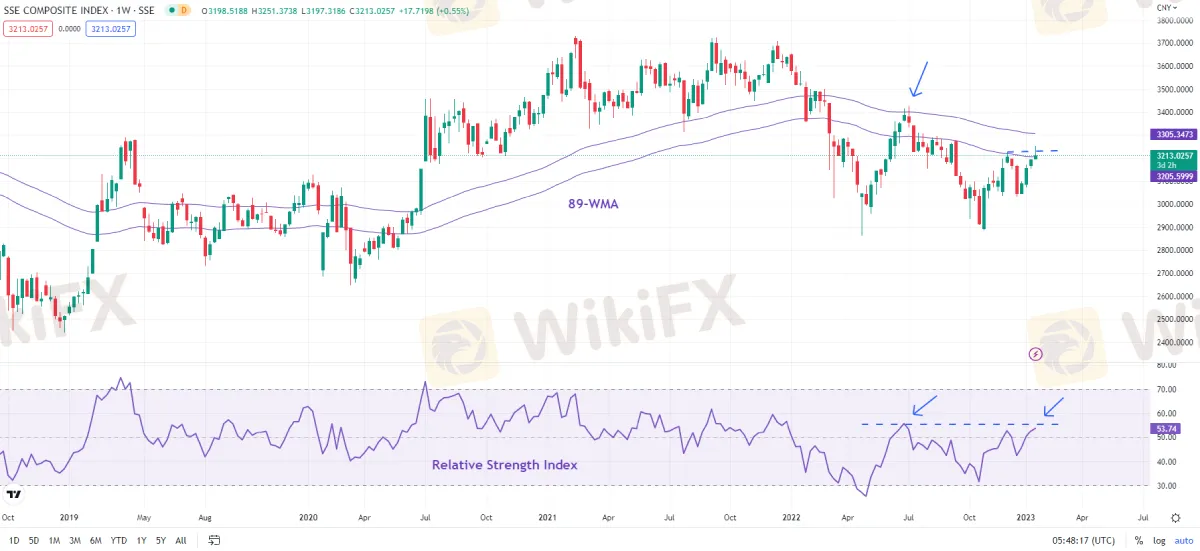
The Shanghai Composite Index has encountered convergent opposition at the December high of 3226, as well as the 200-day and 89-week moving averages. Despite the 13% increase since October, the 14-week Relative Strength Index has yet to reach over 60, which is usually an indication of strong upward momentum. Furthermore, during the last rise in July, the index went down from around the shorter moving average and comparable RSI levels.
Shanghai Composite Index Weekly Chart

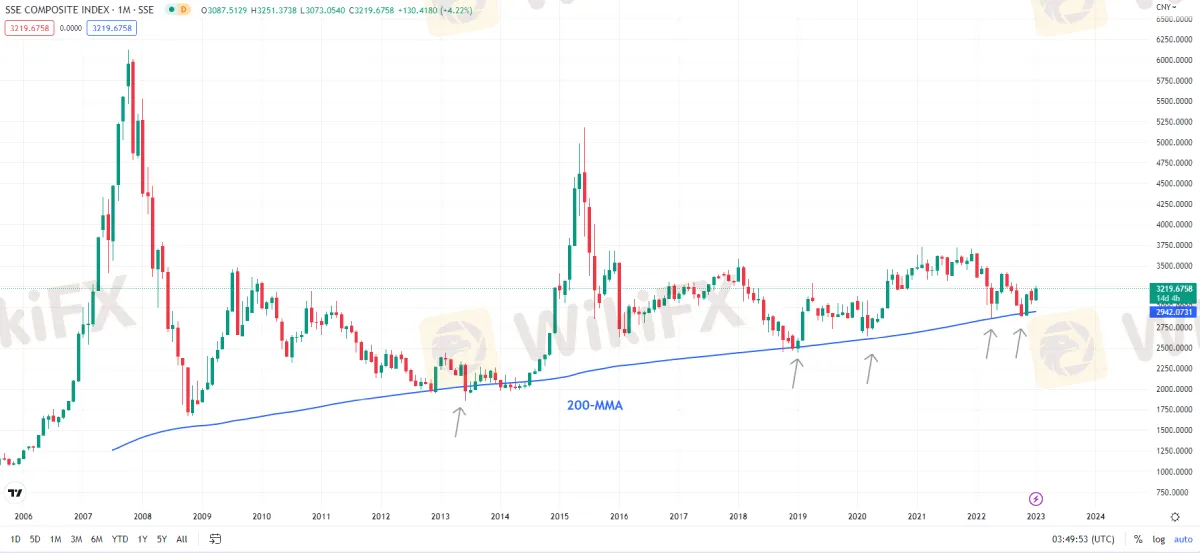
For the medium-term bearish pressure to diminish, the index must convincingly clear both moving averages. Last year's stay above critical support on the 200-month moving average is a positive indication for bulls. However, a stop in the decline around a cushion is insufficient; for any comeback to sustain, the index must break strong obstacles on the upside.
Shanghai Composite Index Monthly Chart

Any breakout over 3225-3300 might pave the road to the July high of 3425. Any break above 3425 would be a positive indicator, triggering a big double bottom (the April and October 2022 lows), indicating a possible rally above 4000 in the next months. On the downside, the index's fledgling comeback is expected to continue as long as it remains above immediate support at the December low of 3032. Any breach there would signal the reversal of the short-term rising pressure.
After statistics published this morning exceeded forecasts, Chinese shares were generally unfazed, but economic growth slowed sharply last year due to tight COVID regulations and a slump in the housing market. The reopening of China's borders earlier this month has fueled optimism for an economic recovery this year. However, the sudden termination of its COVID limitations and the possibility for infection surges indicate that the growth trajectory may be rocky.
Keep an eye out for more market trading analysis.
You can install the WikiFX App on your phone or tablet by using the link below, or by going to the App Store or Google Play Store.
Download link: https://www.wikifx.com/en/download.html

Disclaimer:
The views in this article only represent the author's personal views, and do not constitute investment advice on this platform. This platform does not guarantee the accuracy, completeness and timeliness of the information in the article, and will not be liable for any loss caused by the use of or reliance on the information in the article.
Read more

How Did the Dollar Become the "Dominant Currency"?
Since the fourth quarter of last year, the strong trend of the U.S. dollar has intensified, and as we enter 2025, investors face a contradictory situation.

How to Automate Forex and Crypto Trading for Better Profits
Find out how automating Forex and crypto trading is changing the game. Explore the tools, strategies, and steps traders use to save time and maximize profits.

Is Infinox a Safe Broker?
INFINOX, founded in 2009 in London, UK, is a regulated online broker under the UK FCA. It offers diverse trading instruments like forex, stocks, commodities, indices, and futures. Clients can choose between STP and ECN accounts and access educational resources. With 24/7 customer support, INFINOX aims to empower traders with reliable tools and guidance.

Is Your Zodiac Sign Fated for Stock Market Success in 2025?
The idea that astrology could influence success in the stock market may seem improbable, yet many traders find value in examining personality traits linked to their zodiac signs. While it may not replace market analysis, understanding these tendencies might offer insights into trading behaviour.
WikiFX Broker
Latest News
How to Automate Forex and Crypto Trading for Better Profits
Is Infinox a Safe Broker?
How Did the Dollar Become the "Dominant Currency"?
Is Your Zodiac Sign Fated for Stock Market Success in 2025?
Currency Calculator


