简体中文
繁體中文
English
Pусский
日本語
ภาษาไทย
Tiếng Việt
Bahasa Indonesia
Español
हिन्दी
Filippiiniläinen
Français
Deutsch
Português
Türkçe
한국어
العربية
WIKIFX REPORT: Can USD/ZAR Go For A Higher High?
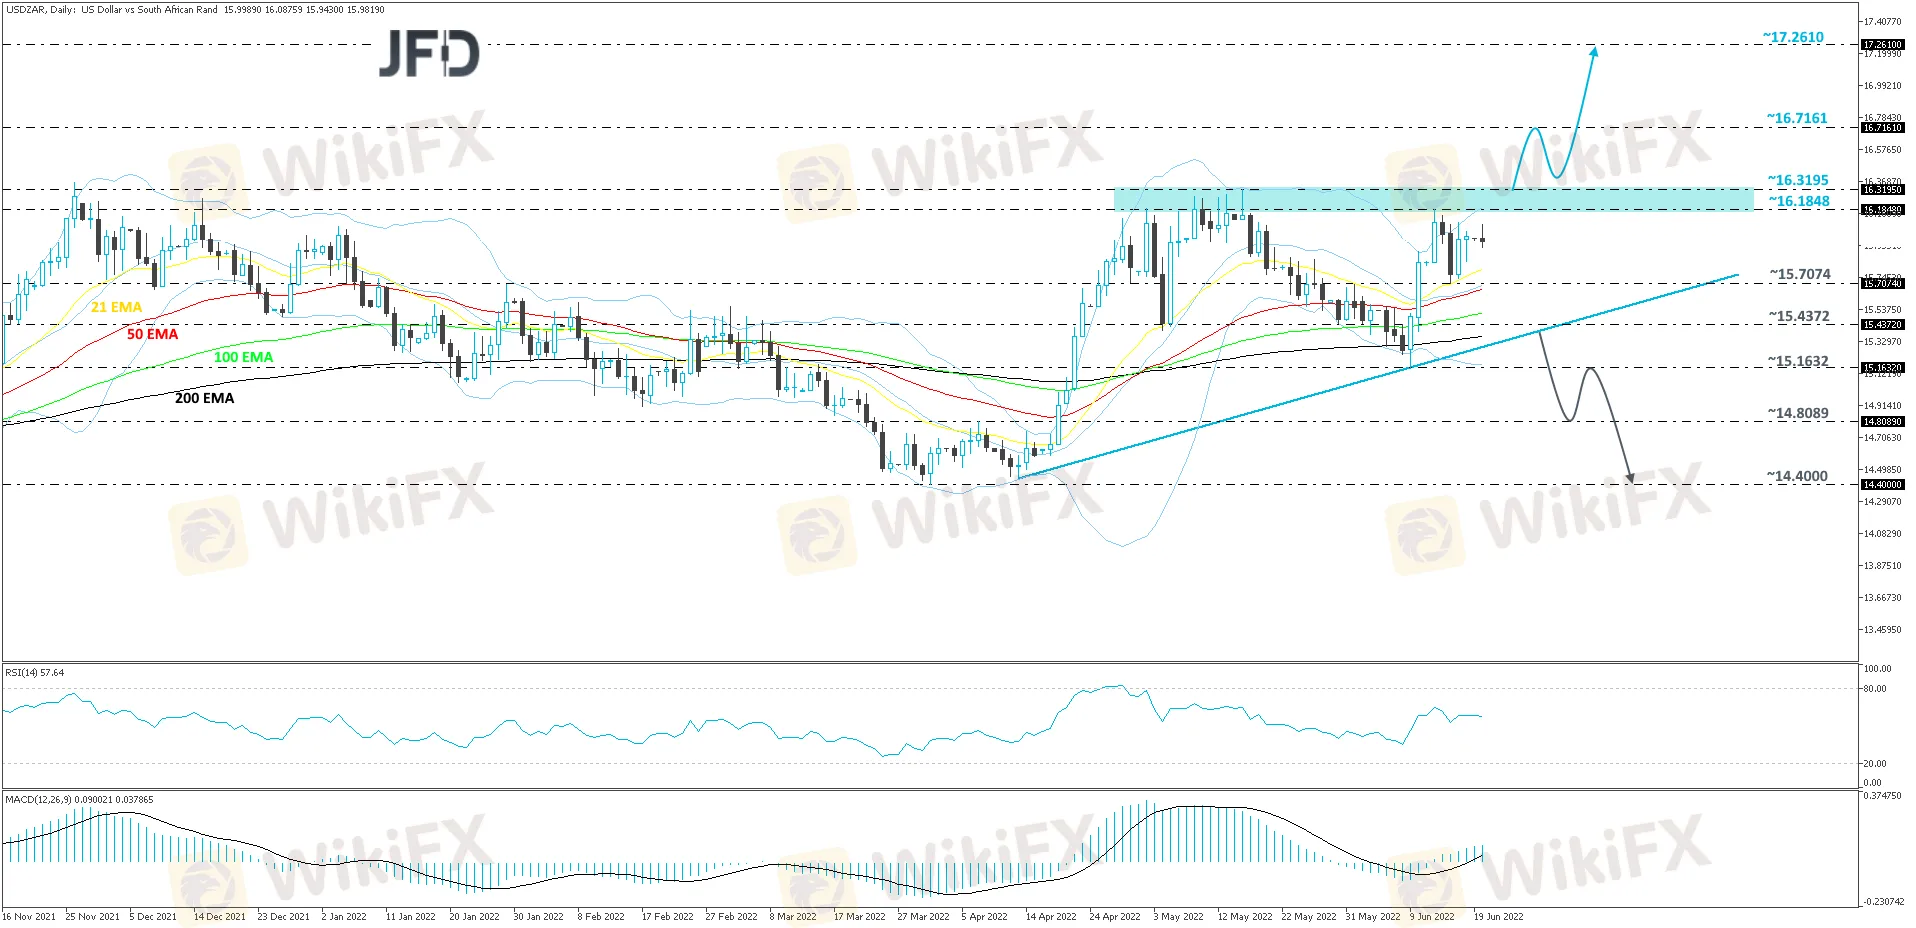
Abstract:Looking at the technical picture of USD/ZAR on our daily chart, we can see that after reversing higher at the end of March, the pair is now trading above a short-term upside support line taken from the low of April 13th. That said, the rate is currently trading below a key resistance area between the 16.1848 and 16.3195 levels, marked by the highs of June 13th and May 16th respectively. In order to aim further north, we would prefer to wait for a push above that resistance area first.
Looking at the technical picture of USD/ZAR on our daily chart, we can see that after reversing higher at the end of March, the pair is now trading above a short-term upside support line taken from the low of April 13th. That said, the rate is currently trading below a key resistance area between the 16.1848 and 16.3195 levels, marked by the highs of June 13th and May 16th respectively. In order to aim further north, we would prefer to wait for a push above that resistance area first.
Such a break will confirm a forthcoming higher high and may open the door to the 16.7161 hurdle, marked by the high of October 15th, 2020. We could see a slight hold-up around there, however, if the buyers remain strong, they might overcome that obstacle and aim for the 17.2610 zone, which is the highest point of September 2020.
The RSI is flat but continues to run above 50. The MACD is pointing higher, while running above zero and the signal line. Overall, the two oscillators show positive price momentum, which supports the upside scenario.
Alternatively, a break of the aforementioned upside line may change the direction of the current short-term trend. USD/ZAR could then drift to the current lowest point of June, at 15.1632, which was tested on the 9th of the month, a break of which might clear the way towards the 14.8089 zone. That zone marks the inside swing high of April 7th. However, if the sellers continue to apply pressure and break that zone, the next possible support area could be at 14.4000, which is the lowest point of March.

Disclaimer:
The views in this article only represent the author's personal views, and do not constitute investment advice on this platform. This platform does not guarantee the accuracy, completeness and timeliness of the information in the article, and will not be liable for any loss caused by the use of or reliance on the information in the article.
Read more

MultiBank Group Wins Big at Traders Fair Hong Kong 2024
Discover how MultiBank Group, a global leader in financial derivatives, secured three prestigious awards at Traders Fair Hong Kong 2024, highlighting its innovative trading solutions and industry excellence.

CySEC Settles Compliance Case with Fxview Operator Charlgate Ltd
Discover how CySEC resolved compliance issues with Charlgate Ltd, the operator of Fxview, through a €50,000 settlement. Explore the investigation, regulatory measures, and CySEC's new website designed for improved accessibility and transparency.

TradingView Launches Liquidity Analysis Tool DEX Screener
Discover TradingView's DEX Screener, a powerful tool for analyzing decentralized exchange trading pairs. Access metrics like liquidity, trading volume, and FDV to make smarter, data-driven trading decisions.

WikiFX Review: Is PU Prime a decent broker?
In today’s article, we have made a comprehensive review of a broker named PU Prime. We wonder if PU Prime is a scam or a reliable broker.
WikiFX Broker
Latest News
Volkswagen agrees deal to avoid Germany plant closures
Geopolitical Events: What They Are & Their Impact?
Top 10 Trading Indicators Every Forex Trader Should Know
TradingView Launches Liquidity Analysis Tool DEX Screener
MultiBank Group Wins Big at Traders Fair Hong Kong 2024
WikiEXPO Global Expert Interview: Simone Martin—— Exploring Financial Regulation Change
'Young investors make investment decisions impulsively to keep up with current trends' FCA Reveals
Why Do You Feel Scared During Trade Execution?
CySEC Settles Compliance Case with Fxview Operator Charlgate Ltd
Scope Markets Review: Trustworthy or Risky?
Currency Calculator


