简体中文
繁體中文
English
Pусский
日本語
ภาษาไทย
Tiếng Việt
Bahasa Indonesia
Español
हिन्दी
Filippiiniläinen
Français
Deutsch
Português
Türkçe
한국어
العربية
Price Action: The Power of the Wick
Abstract:Probably one of the more compelling areas of price action is in its ability to show key levels or price zones that matter. And to be sure, there’s a lot of ways of finding potential support and resistance levels but none of those prices are worth very much if they don’t actually show as support or resistance.

For the purpose of identifying support and resistance, candlestick wicks can be incredibly powerful and this also speaks to multiple time frame analysis.
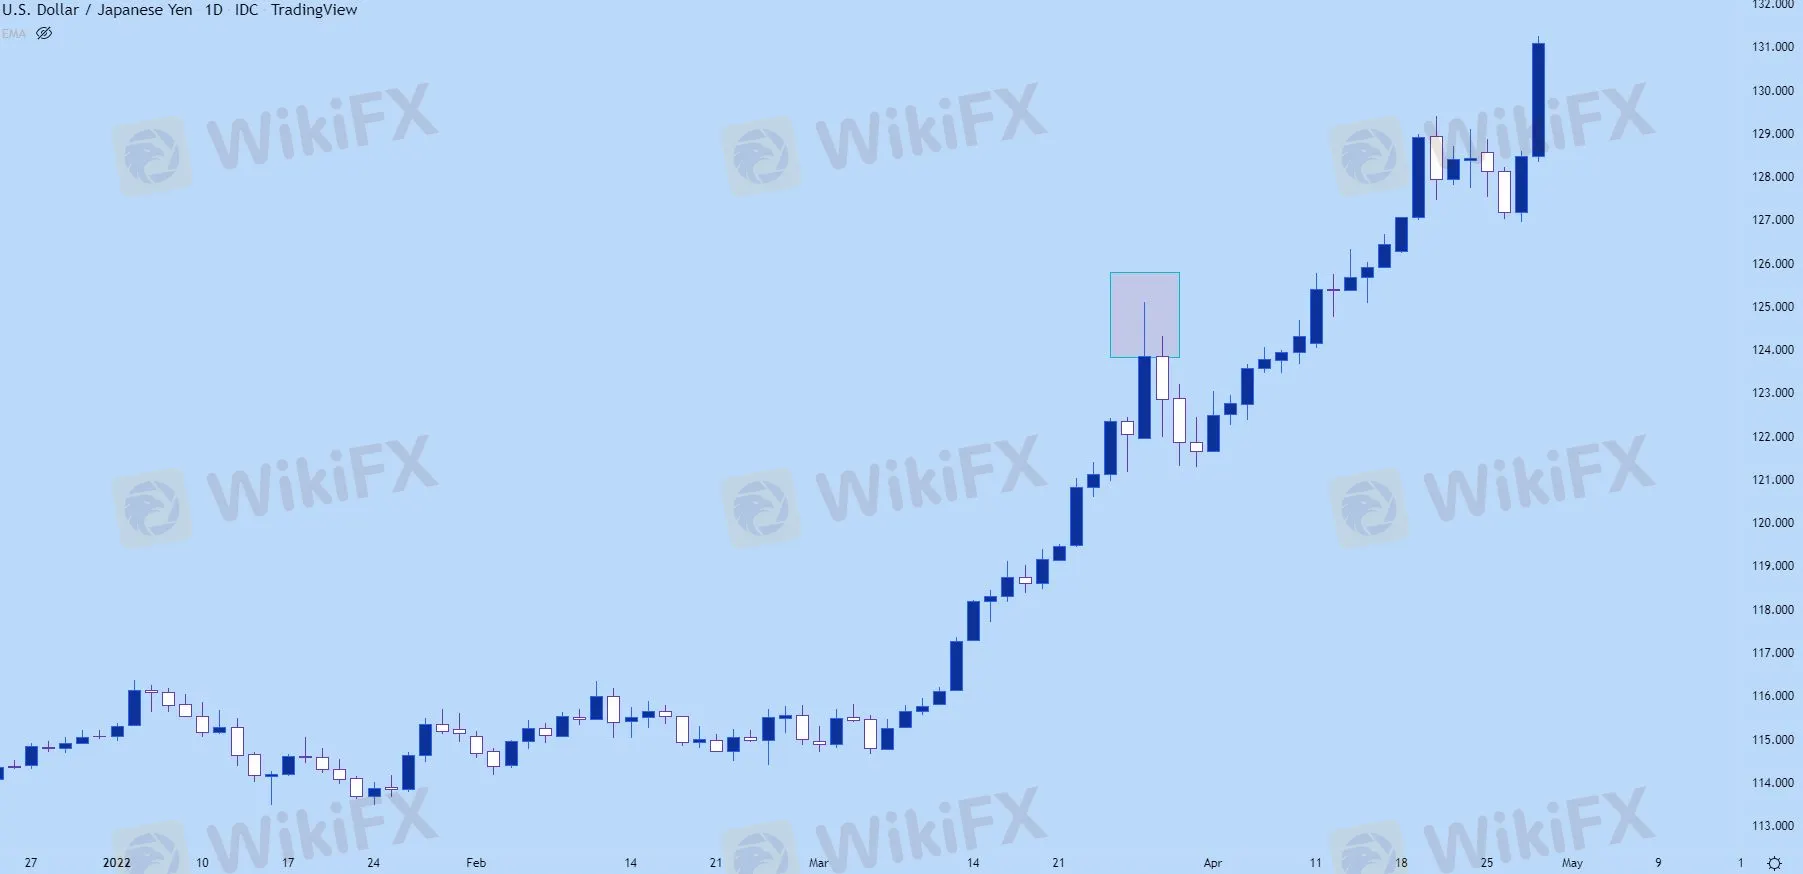
If youre following prices on an hourly chart and price suddenly reverses from a bullish trend, erasing the entirety of the move – how would that show on a daily chart?
Likely, this will illustrate as a wick sitting atop that daily bar indicating the reversal that had taken place. On the below daily chart of USD/JPY, Ive identified such an extended wick, and notice that the three days that followed continued to see prices pull back despite a very strong trend that led into the move.
USD/JPY Daily Price Chart

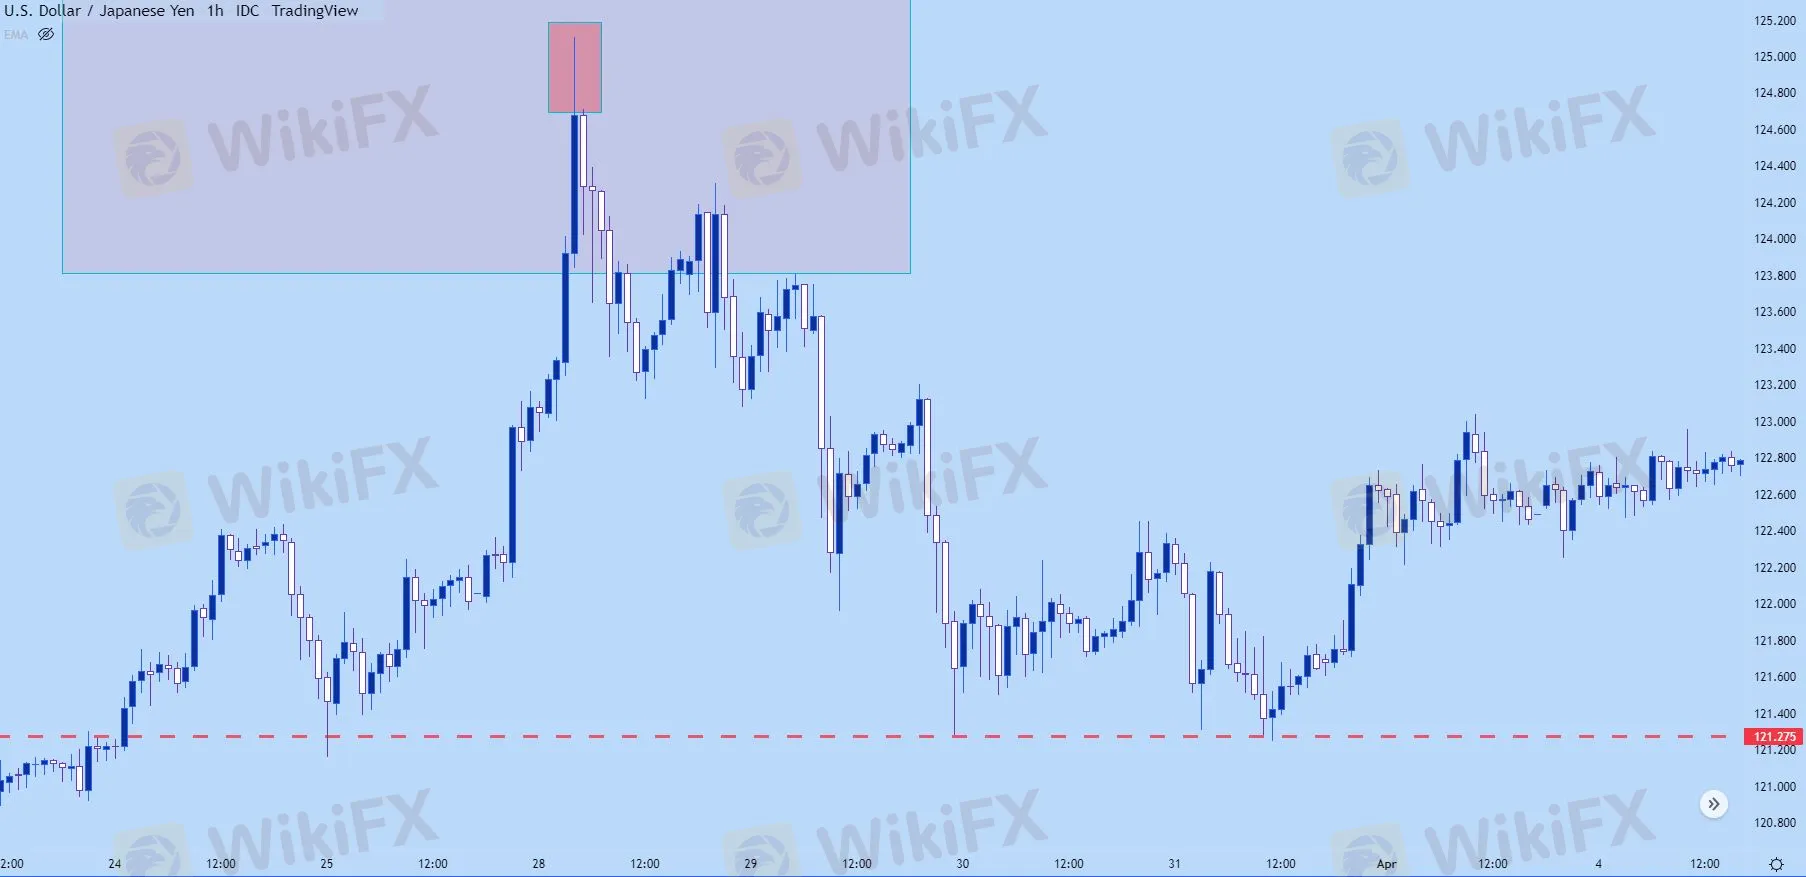
On the below hourly chart, were taking a closer look at that same iteration and we can see that there was an extended upper wick there, as well, albeit much smaller than the wick that showed on the daily.
That three day sell-off started from a fairly clear reversal that had even showed on the hourly chart.
What‘s going on here: Likely there was a catalyst of some type that started a fast reversal and this is simply the playing out of that new ’bearish‘ factor getting priced-in. And, as we looked price action trends, trends do not move in a linear manner, its often a sequencing of ’two steps forward, one step back,‘ and that’s showing in the below example after the reversal began as ‘two steps down, one step up.’
USD/JPY Hourly Price Chart

You might notice on the above chart, the red line along the bottom. Well that‘s pretty key for support and resistance identification when using price action, and we’ll dig into that in our next article on the topic.

Disclaimer:
The views in this article only represent the author's personal views, and do not constitute investment advice on this platform. This platform does not guarantee the accuracy, completeness and timeliness of the information in the article, and will not be liable for any loss caused by the use of or reliance on the information in the article.
Read more

RM5.9M Lost to "Davidson Kempner Capital Management" Facebook Scam
A private contractor in Malaysia faced a devastating loss of over RM5.9 million after falling victim to a fraudulent investment scheme promoted on Facebook. Tempted by the scheme’s impressive claims and credentials, the victim began investing in September 2024. The investment process required him to download an application called A-Trade, which was readily available on the Apple Store.

Is There Still Opportunity as Gold Reaches 4-Week High?
Gold Continues to Rise, can the Bulls Keep Going? Recently, gold prices have been on the rise, especially following the release of the non-farm payrolls data, as demand for gold as a safe-haven asset continues to increase.

This Economic Indicator Sparks Speculation of a Japan Rate Hike!
The latest data shows that Japan’s base wages in November rose by 2.7% year-on-year, marking the largest increase in 32 years, fueling speculation about a potential BOJ rate hike, but Governor Kazuo Ueda’s dovish remarks in December have shifted market expectations toward a potential delay in policy adjustments.

Challenge Yourself: Transform from Novice to Expert
From a forex novice to a trading expert, all it takes is this one opportunity! Join us for the Forex Beginner's Advancement Journey challenge and unlock your potential! Here, if you're a beginner, participating in the event and posting on selected topics will not only deepen your understanding of forex basics and help you advance but also earn you a Learning Encouragement Award. For those with some experience in forex, discussing insights under the event topics will allow you to exchange experiences and share techniques with like-minded peers, while also having the chance to win a Perspective Sharing Award! Come challenge yourself and break through the limits of forex trading together!
WikiFX Broker
Latest News
SQUARED FINANCIAL: Your Friend or Foe?
Big News! UK 30-Year Bond Yields Soar to 25-Year High!
ACY Securities Integrates MetaTrader 5 to Enhnace Copy Trading Service
Soegee Futures Review: Should You Trust This Broker?
Malaysian Pilot Loses RM1.36 Million in UVKXE Investment App Scam
Indonesia officially joins the BRICS countries
Attention! Goldman Sachs Cuts Gold Target to $2910
Inflation Rebounds: ECB's Big Rate Cut Now Unlikely
Carney \considering\ entering race to replace Canada\s Trudeau
High-Potential Investments: Top 10 Stocks to Watch in 2025
Currency Calculator


