简体中文
繁體中文
English
Pусский
日本語
ภาษาไทย
Tiếng Việt
Bahasa Indonesia
Español
हिन्दी
Filippiiniläinen
Français
Deutsch
Português
Türkçe
한국어
العربية
Dow Jones Technical Analysis: Index Rising Cautiously
Abstract:The Dow Jones Industrial Average rose during its recent trading at the intraday levels, breaking a series of losses that continued for five consecutive sessions, achieving gains in the last of them by 2.15%. The index gained about 658.08 points and settled at the end of trading at the price of 31,288.26, after it declined in trading on Thursday by -0.46%, to close the week with losses of -0.17%
The Dow Jones Industrial Average rose during its recent trading at the intraday levels, breaking a series of losses that continued for five consecutive sessions, achieving gains in the last of them by 2.15%. The index gained about 658.08 points and settled at the end of trading at the price of 31,288.26, after it declined in trading on Thursday by -0.46%, to close the week with losses of -0.17%

Atlanta Fed President Rafael Bostick suggested on Friday that he would not support a potential higher price movement, CNBC reported, while St. Louis Bank President James Bullard favors a 75 basis point increase later this month, Bloomberg reports. .
On the economic data front, retail sales rose 1% month over month in June, up from a 0.1% decline in May and above expectations for a 0.9% increase.
Although some of the increase was linked to higher gasoline and food prices, the market seemed optimistic that the critical consumer had not yet succumbed to the strongest inflation in four decades.
While the University of Michigan Consumer Confidence Index rose to 51.1 this month from a record low of 50 in June. The index of long-term inflation expectations fell to 2.8%.
The probability of the Federal Reserve raising interest rates by 100 basis points fell to 31% from nearly 45% Thursday, according to the CME FedWatch Tool, after the latest consumer price index turned out to be hotter than expected for June, strengthening the case for Stronger policy response from the central bank.
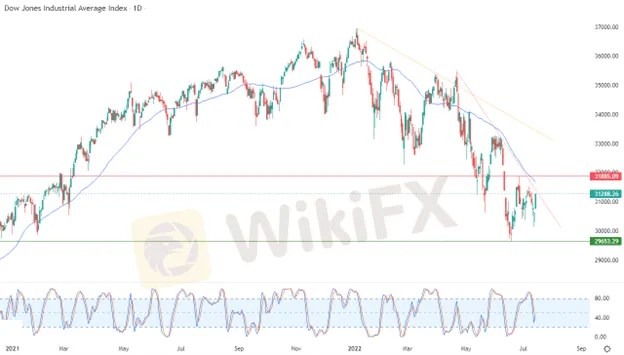
Technically, the index rises along a minor and corrective bearish slope line in the short term, as shown in the attached chart for a (daily) period, at a time when it suffers from continuous negative pressure due to its trading below the simple moving average for the previous 50 days. There are negative signals on the RSI indicators, after reaching earlier overbought areas.
Therefore, our expectations suggest a return to the index's decline during its upcoming trading, as long as the resistance level 31,885 remains intact, to target again the important support level 29,653.30.
Disclaimer:
The views in this article only represent the author's personal views, and do not constitute investment advice on this platform. This platform does not guarantee the accuracy, completeness and timeliness of the information in the article, and will not be liable for any loss caused by the use of or reliance on the information in the article.
WikiFX Broker
Latest News
Geopolitical Events: What They Are & Their Impact?
Volkswagen agrees deal to avoid Germany plant closures
Top 10 Trading Indicators Every Forex Trader Should Know
TradingView Launches Liquidity Analysis Tool DEX Screener
MultiBank Group Wins Big at Traders Fair Hong Kong 2024
WikiEXPO Global Expert Interview: Simone Martin—— Exploring Financial Regulation Change
'Young investors make investment decisions impulsively to keep up with current trends' FCA Reveals
Why Do You Feel Scared During Trade Execution?
CySEC Settles Compliance Case with Fxview Operator Charlgate Ltd
Malaysian Influencer Detained in Taiwan Over Alleged Role in Fraud Scheme
Currency Calculator


