简体中文
繁體中文
English
Pусский
日本語
ภาษาไทย
Tiếng Việt
Bahasa Indonesia
Español
हिन्दी
Filippiiniläinen
Français
Deutsch
Português
Türkçe
한국어
العربية
Natural Gas Technical Analysis: Price Moving in a Narrow Range
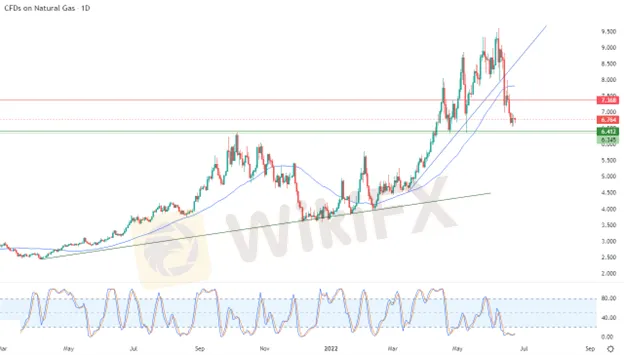
Abstract:Spot natural gas prices (CFDS ON NATURAL GAS) declined in their recent trading at the intraday levels, to record daily losses until the moment of writing this report, by -0.90%. It settled at the price of $6.753 per million British thermal units, after falling slightly during yesterday’s trading by - 0.15%.
Spot natural gas prices (CFDS ON NATURAL GAS) declined in their recent trading at the intraday levels, to record daily losses until the moment of writing this report, by -0.90%. It settled at the price of $6.753 per million British thermal units, after falling slightly during yesterdays trading by - 0.15%.
Natural gas futures continued to fluctuate in a narrow range, as the Nymex gas contract for July settled at $6.858 per million British thermal units, up 5 cents from the day. The August futures contract rose by 8.9 cents to $6.872.

NGI's Spot Gas National Avg spot gas prices were mostly trading higher, given record-high temperatures across much of the US and strong demand for cooling capacity.
With demand for liquefied natural gas (LNG) already hampered by the outage at the Freeport terminal, an additional drop in feed gas deliveries helped pull futures lower early Wednesday. Some analysts have indicated that gas shipments to US LNG facilities have fallen to about 10.5 billion cubic feet. However, data tracking US LNG exports from NGI indicated a recovery in feed gas volumes, to around 11.2 billion cubic feet.
The market should get a reading of the weekly inventory data when it is released from the US Energy Information Administration (EIA), in order to learn about the effects of the Freeport explosion and the subsequent outage of storage.
Prior to the latest inventory data, Reuters polled 13 analysts whose estimates ranged with storage injections ranging from 56 billion cubic feet to 76 billion cubic feet, resulting in an average increase of 66 billion cubic feet. A Bloomberg survey showed lower average stocks of 59 billion cubic feet, although the range of estimates was the same. Meanwhile, the Wall Street Journal poll had a narrower forecast range, averaging 66 billion cubic feet.
Technically, the price continues to correct the main bullish trend in the short term, amid its trading along a major bullish slope line in the medium term. This is shown in the attached chart for a (daily) period, with the start of positive signs from the relative strength indicators, after it reached oversaturated areas with operations selling. The negative pressure of the previous 50-day SMA remains preventing the commodity from rising.
Therefore, our expectations still suggest a rise in natural gas during its upcoming trading, provided that the support level 6.412 remains intact, to target the first resistance levels at 7.368.
Disclaimer:
The views in this article only represent the author's personal views, and do not constitute investment advice on this platform. This platform does not guarantee the accuracy, completeness and timeliness of the information in the article, and will not be liable for any loss caused by the use of or reliance on the information in the article.
WikiFX Broker
Latest News
ASIC Sues Binance Australia Derivatives for Misclassifying Retail Clients
Geopolitical Events: What They Are & Their Impact?
Top 10 Trading Indicators Every Forex Trader Should Know
Why Do You Feel Scared During Trade Execution?
Revolut Leads UK Neobanks in the Digital Banking Revolution
Fusion Markets: Safe Choice or Scam to Avoid?
SEC Approves Hashdex and Franklin Crypto ETFs on Nasdaq
North Korean Hackers Steal $1.3bn in Cryptocurrency in 2024
Currency Calculator


