简体中文
繁體中文
English
Pусский
日本語
ภาษาไทย
Tiếng Việt
Bahasa Indonesia
Español
हिन्दी
Filippiiniläinen
Français
Deutsch
Português
Türkçe
한국어
العربية
FOREX EDUCATION, The stages of a forex trend
Abstract:We’ve all heard the phrase, “the trend is your friend” in this educational piece we discuss how to identify a trend, as well the simplest introduction on how to trade online with the prevailing trend of any given asset.

What is a trend.
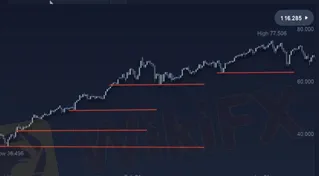
In Forex we can define a trend as an assets price action moving in a certain direction, up, down or ranging sideways, this shows the markets agenda for that specific asset, if price is trending up, we identify it with higher highs and higher lows as illustrated below, giving high probability buy setups, *Remember that price will remain in an uptrend as long as price does not break below the previous higher low.

In the picture below we have an illustration of a downtrend, identified by lower highs and lower lows, giving the trader higher probability sell setups.
*Remember that price remains in a downtrend as long as price does not break the most previous lower high.

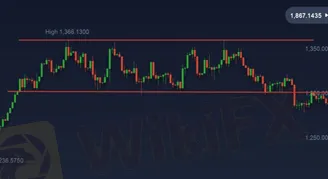
Next we have an illustration of a ranging market, identified by equal highs and equal lows, also known as liquidity stacking and usually occurs after the market has been trending and before the market moves in the desired direction.
*Remember that price remains in a range as long as price remains within the equal highs and equal lows.

The above, all illustrate chart trends of specific assets, now lets briefly discuss a different kind of trend and outline how it reflects on the charts, this is known as the macro economic trend.
A macro economic trend refers to a countries economic trend or status, for example, recently South Africa has been through a series of dramatic events that shifted the overall economy into a downtrend, now what exactly this is not important for this article but you can find out more details on this on the WikiFX platform, what is important to focus on as a trader is how the macro economics affects the candlestick charts and what we can see based on the economic sentiment.

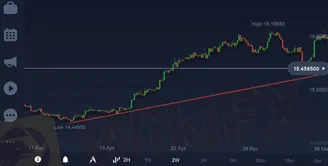
Okay, so if the macro economic outlook is bad for South Africa at the moment, this will translate to the asset price of USD/ZAR to trend to the upside, indication South African Rand weakness, and will manifest on the charts as illustrated above.
So to begin to attain success as a forex trader, one must develop the skill of marrying the macro economic trends to the chart trends along with some other technical and fundamental aspects in order to better predict which way a given asset will trend and capitalize on any data that gives a strong guideline as to what good trading decisions to take.
Interdependence of trends and ranges.
As previously discussed, up and down trends are a representation of higher highs and high lows, as well as lower highs and lower lows, respectively, and a range is just price drifting sideways creating equal highs and lows, although ranges have different characteristics to up and down trends, they are actually interdependent on each other, what do I mean? Well, lets say for example, price is in an uptrend and the buyer have now lost interest and have begun to close their positions and take profits, as this is happening, the asset price begins to range or consolidate and starts to show signs that it is changing character by breaking either the most recent higher low, lower high or equal highs or lows, getting back to our illustration, once the uptrend is depleted, price will range for a bit and then either change direction or continue in its original trend, the change of direction or continuation will be Identified when price breaks out of the range and gives clear signs of reversal or continuation, thus showing that trends and ranges are interdependent.
Identifying the trend and establishing a directional bias.
With some screen time and trading experience, a trader will become able to open a chart and immediately identify the trend based on previously mentioned market structure (higher highs, etc.), another way to determine the trend is to plot a short, medium or long term moving average on your chart, depending on the type of trader you are. Scalpers for example, who are in and out of the market fairly quickly will make use of a short term moving average, while day traders who hold trades for a day or so will make use of medium term moving averages and swing or position traders will generally use the longer term moving averages. The methodology behind the moving average is to plot either a 20, 50 or 100 period moving average depending again on the type of trader you are, if price is trading above the moving average, you have yourself and uptrend, if price is below, a downtrend is evident and if price is moving in middle of price action we are ranging or consolidating.
· For buying opportunities, a trader will identify an asset trading above the desired moving average, a trading plan could be to wait for price to break above an immediate level of structure, wait for price to retest and respect the structure and moving average giving a favorable candlestick to signal an entry, drop to a lower time frame and strike with at least three factors of confluence.
· For selling opportunities, a trader would follow the same procedure, just flipping the direction bias, price trading below the moving average, break of immediate structure to the downside, wait for retest and respect of structure level and moving average, strike with three or more factors of confluence to support tour trading decisions.
· For ranging or sideways markets, do your best to stay away and wait for a CO firmed break out and beginning of a new trend.
· Rules for stop loss trailing, you can always trail your stop loss to minimize risk as price trades toward your take profit, a good rule here would be to trail your stop loss just above or below your moving average.
Recap and conclusion.
To quickly recap, a trend is an assets price moving in one of three directions, up, down or sideways, uptrend (higher highs; higher lows), downtrend (lower highs; lower lows), sideways/ranging (equal highs; equal lows). Up and down trends are interdependent on ranges, trends occur just before or just after ranging, macro economic trends work in conjunction with chart trends, taking all the information into account it is important to note that any moving average in just but one factor of confluence, the ideal trading plan will include using macro economics (fundamentals), moving averages as well as other technical analysis all in confluence with each other to ensure you take only the highest probability setups.
For more forex trading educational content download the WikiFX app using this link https://wikifx1.onelink.me/QUVu/FxMustHaveApp502 or contact me via email chaddgilmour6@gmail.com

Disclaimer:
The views in this article only represent the author's personal views, and do not constitute investment advice on this platform. This platform does not guarantee the accuracy, completeness and timeliness of the information in the article, and will not be liable for any loss caused by the use of or reliance on the information in the article.
Read more

How to Know if the Market is Correcting or Reversing?
In trading, distinguishing between a market correction and a market reversal is crucial for making sound decisions. Misjudging one for the other can lead to missed opportunities or significant losses. While both involve price movements, their causes, duration, and implications differ substantially. Understanding these differences can help traders improve their strategies and adapt to market conditions effectively.

The Hidden Checklist: Five Unconventional Steps to Vet Your Broker
Forex broker scams continue to evolve, employing new tactics to appear credible and mislead unsuspecting traders. Identifying these fraudulent schemes requires vigilance and strategies beyond the usual advice. Here are five effective methods to help traders assess the legitimacy of a forex broker and avoid potential pitfalls.

What Are The Common Types of Unregulated Forex Brokers?
Protect your investments from unregulated forex brokers with these tips. Learn about red flags, scams, and how the WikiFX app ensures safe trading experiences worldwide.

Pros and Cons of Choosing Unregulated Forex Brokers
Discover the pros and cons of unregulated forex brokers, explore risks, benefits, and key features, and learn how to evaluate their credibility with the WikiFX app.
WikiFX Broker
Latest News
Russia to Fully Ban Crypto Mining in 10 Regions Starting January 1, 2025
Why is there so much exposure against PrimeX Capital?
Two Californians Indicted for $22 Million Crypto and NFT Fraud
RM62k Lost Investment Scam After Joining XRP Community Malaysia on Telegram
Victims of Financial Fraud in France Suffer Annual Losses of at Least €500 Million
WikiFX Review: Is Ultima Markets Legit?
Colorado Duo Accused of $8M Investment Fraud Scheme
What Impact Does Japan’s Positive Output Gap Have on the Yen?
Macro Markets: Is It Worth Your Investment?
Malaysia Pioneers Zakat Payments with Cryptocurrencies
Currency Calculator


