简体中文
繁體中文
English
Pусский
日本語
ภาษาไทย
Tiếng Việt
Bahasa Indonesia
Español
हिन्दी
Filippiiniläinen
Français
Deutsch
Português
Türkçe
한국어
العربية
BTC/USD Forecast: Bitcoin Bounces from Crucial 200-Day EMA
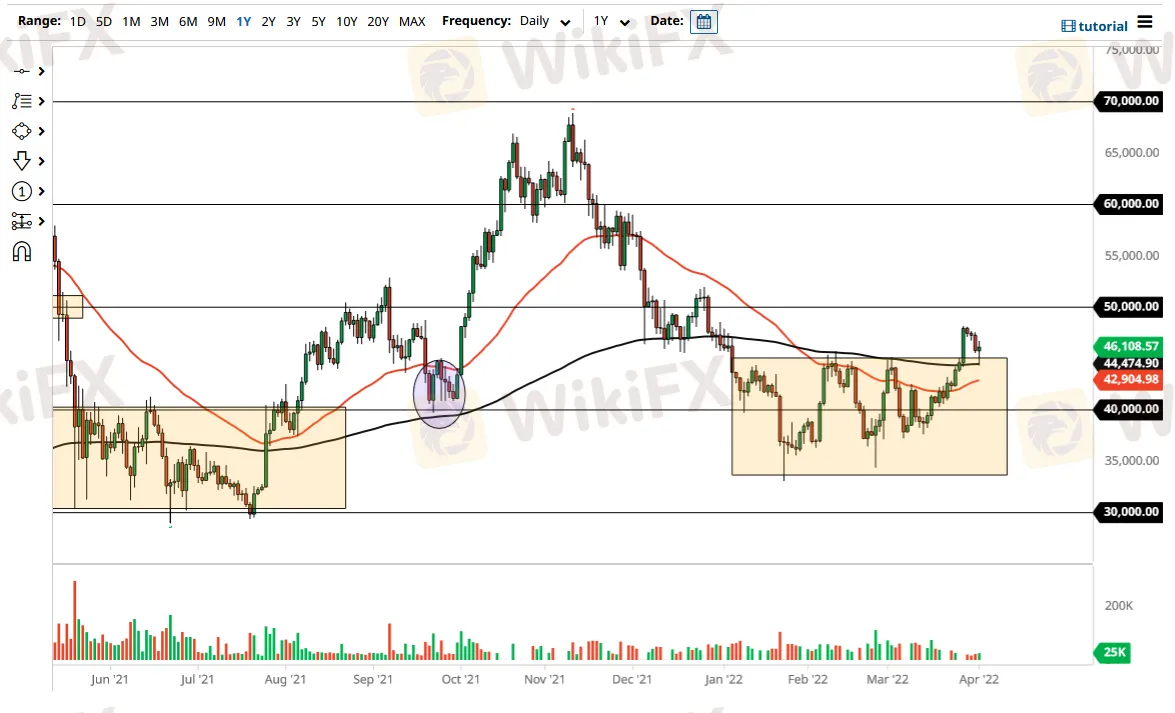
Abstract:The Bitcoin market has fallen a bit on Friday to pierce the $45,000 level, and then test the 200-day EMA. The 200 Day EMA is an indicator that a lot of people will pay close attention to, and it is likely that this will be your “line in the sand” that players in the market will be focusing on. The fact that we have turned around and bounced the way we have is a good sign, although it does it necessarily mean that we have to rally.
The Bitcoin market has fallen a bit on Friday to pierce the $45,000 level, and then test the 200-day EMA. The 200 Day EMA is an indicator that a lot of people will pay close attention to, and it is likely that this will be your “line in the sand” that players in the market will be focusing on. The fact that we have turned around and bounced the way we have is a good sign, although it does it necessarily mean that we have to rally.

If we break above the top of the candlestick for the trading session on Friday, that would be a bullish sign that could send this market back towards the recent highs. After that, the market could go looking to the $50,000 level which is the next large, round, psychologically significant figure. The $50,000 level will attract a lot of headline attention, and I think a lot of profit-taking could take place in that general vicinity.
Furthermore, if we were to break above the $51,000 level, it could open up fresh buying, perhaps in a bit of a “FOMO move.” The market has been a bit noisy over the last couple of days, but it is starting to look very much like a market that has broken out, pulled back to retest the previous resistance area, and now might be willing to go higher. That being said, if we were to break down below the 200 Day EMA, it is likely that we could go looking to the 50 Day EMA, maybe even down to the $40,000 level.
If we were to break down below the $40,000 level, then it would be a very negative sign, perhaps opening up the possibility of a move down to the $35,000 level, which would then open up the floodgates. That does not look as likely now, and you could even make the argument that we have just broken out of a major “W pattern”, although it is a bit complex. As things stand right now, it looks as if crypto is trying to make its way back, but keep in mind that there are still a lot of fears out there that people will have to deal with, and we could see a “risk-off” move happen relatively soon.
Disclaimer:
The views in this article only represent the author's personal views, and do not constitute investment advice on this platform. This platform does not guarantee the accuracy, completeness and timeliness of the information in the article, and will not be liable for any loss caused by the use of or reliance on the information in the article.
WikiFX Broker
Latest News
Saxo & Portuguese Bank Partnership
SEC Fines Broker-Dealers $275K for Incomplete SAR Filings
Lured by False Promises: Malaysian Driver Lost RM218K to an Investment Scam
FTX Sets March 2025 Timeline for Creditor Payouts: What It Means for Investors
What is an Economic Calendar? How it works
Italian Regulator Warns Against 5 Websites
SFC Freezes $91M in Client Accounts Amid Fraud Probe
Bybit Launches Gold & FX Treasure Hunt with Real Gold Rewards
Mastercard's 2030 Vision: Biometric-Driven, Tokenized Payments
What Are the Latest Trends and Strategies in Philippine Gold Trading?
Currency Calculator


