简体中文
繁體中文
English
Pусский
日本語
ภาษาไทย
Tiếng Việt
Bahasa Indonesia
Español
हिन्दी
Filippiiniläinen
Français
Deutsch
Português
Türkçe
한국어
العربية
The Basics of Forex Trading
Abstract:First-time traders are often overwhelmed with trade terminology when beginning in forex.

Todays publication aims to enlighten you regarding the building blocks of forex trading . Familiarizing yourself with forex basics empowers you as an investor to make more educated market projections and, in turn, more accurate investments. Primarily, you will learn key forex terms and how those definitions help embody the formation, navigation and user engagement of the foreign exchange market.
Our core concepts today include:
Market Flow
Forex Definitions
Currency Pair Groups
Types of Forex Trades
Market Flow
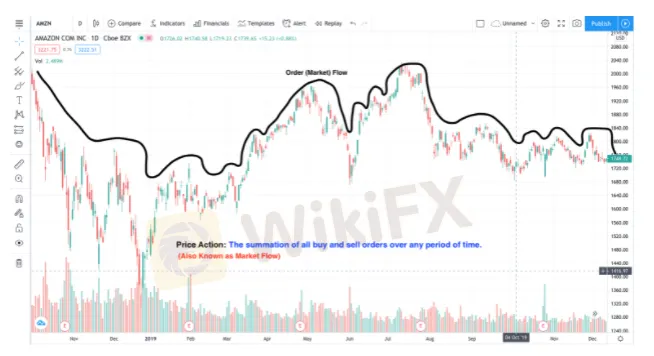
The total of all buy and sell orders over any given period is known as price action. In other words, the market flow you see when looking at a stock chart image is price action. Many forex traders use technical analysis to understand real-time market flow better while gaining critical insights regarding asset support and resistance levels, high and low values, momentum, etc. By doing so, traders can better position themselves for more suitable investment opportunities.

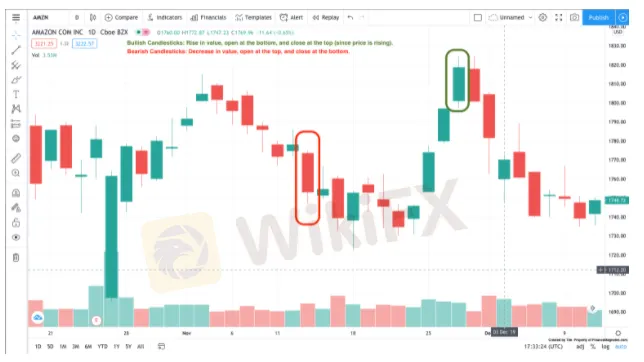
To best monitor an asset in real-time, many forex traders use Japanese candlestick charting to gain more detailed insight into an assets market flow. The core advantages of Japanese candlesticks include:
Gain overall market sentiment (bullish or bearish).
See how your asset is economically performing.
Japanese candlestick formations reveal market insights not seen in other charting styles.

When charting with Japanese candlesticks, know that you can change the amount of time a candlestick represents (typically 1 minute, 5 minutes, 15 minutes, 1 hour, 4 hours, one day, and one week). For instance, if you set your period to 1 hour, every candlestick reflects 1 hour of market flow. More than one candlestick composes what we know as order flow, or for forex traders, that currency pairs price action. As a result, one of the three following market trends may occur:
Bullish Trend
When a currency pair is appreciating, it is known as being bullish. In bullish markets, investor confidence is high, while emerging market currencies (EME), the Australian dollar (AUD), New Zealand dollar (NZD), and the Canadian dollar (CAD) tend to appreciate. On the other hand, safe-haven currencies like the US dollar (USD), Japanese Yen (JPY), and the Swiss Franc (CHF) tend to depreciate as an investors general risk tolerance increases. Traders strategically enter bullish markets with the intent to sell once they believe the market has peaked.

Disclaimer:
The views in this article only represent the author's personal views, and do not constitute investment advice on this platform. This platform does not guarantee the accuracy, completeness and timeliness of the information in the article, and will not be liable for any loss caused by the use of or reliance on the information in the article.
Read more

Will the Euro and US Dollar Reach Parity in 2025?
Euro-dollar parity sparks debate again as 2025 approaches, with multiple factors shaping the exchange rate outlook.

US Dollar Surge Dominates Forex Market
The global forex market continues to show volatility, with the U.S. dollar fluctuating last week but overall maintaining a strong upward trend. How long can this momentum last?

Oil Prices Soar for 5 Days: How Long Will It Last?
Last week, the global oil market saw a strong performance, with Brent crude and WTI crude prices rising by 2.4% and around 5% respectively. Oil prices have now posted five consecutive days of gains. But how long can this rally last?

Fed Signals Only Two Rate Cuts This Year as Inflation Remains Above 2% Target
The Federal Reserve prioritizes inflation control and economic stability, signaling limited rate cuts amid persistent price pressures.
WikiFX Broker
Latest News
SQUARED FINANCIAL: Your Friend or Foe?
Big News! UK 30-Year Bond Yields Soar to 25-Year High!
High-Potential Investments: Top 10 Stocks to Watch in 2025
Why Is Nvidia Making Headlines Everywhere Today?
Discover How Your Trading Personality Shapes Success
US Dollar Insights: Key FX Trends You Need to Know
FINRA Charges UBS $1.1 Million for a Decade of False Trade Confirmations
BI Apprehends Japanese Scam Leader in Manila
Bitcoin in 2025: The Opportunities and Challenges Ahead
Join the Event & Level Up Your Forex Journey
Currency Calculator


