简体中文
繁體中文
English
Pусский
日本語
ภาษาไทย
Tiếng Việt
Bahasa Indonesia
Español
हिन्दी
Filippiiniläinen
Français
Deutsch
Português
Türkçe
한국어
العربية
Wedge Chart Patterns: How to Trade Them
Abstract:Two trend lines converge in a Wedge chart pattern. This indicates that the size of price fluctuation within the Wedge pattern is shrinking. Wedges designate a break in the current trend.
Two trend lines converge in a Wedge chart pattern.
This indicates that the size of price fluctuation within the Wedge pattern is shrinking.
Wedges designate a break in the current trend.
When you see this pattern, it means that forex traders are still debating where the pair should go next.
A Falling Wedge is a bullish chart pattern with downward sloping lines that occurs in an upward trend.
A Rising Wedge is a bearish chart pattern with upward sloping lines that appears in a declining trend.
Wedges can be used to create both continuation and reversal patterns.
Wedge that is rising
When the price consolidates between upward sloping support and resistance lines, a rising wedge is produced.
The slope of the support line is steeper than the resistance line in this case.
Higher lows are forming faster than higher highs, implying that higher lows are forming faster than higher highs. This results in a wedge-shaped configuration, which is how the chart pattern got its name!
We know a big splash is coming as prices consolidate, so we may expect a breakout to either the top or bottom.
It's usually a bearish reversal pattern if the rising wedge forms following an uptrend.
If it occurs during a downtrend, on the other hand, it may indicate that the downtrend will continue.
In any case, the crucial point is that you have your entry orders ready when you detect this forex trading chart pattern!

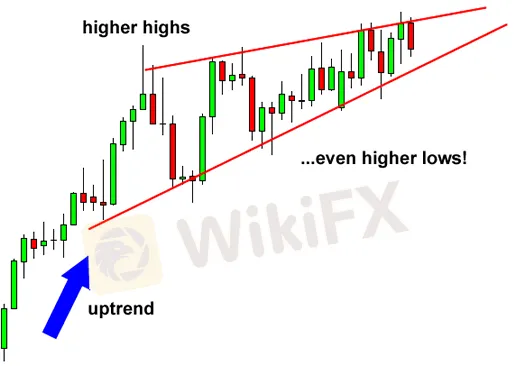
A rising wedge formed at the end of an uptrend in this first case.
Notice how price is generating new highs, but at a far slower rate than it is making higher lows.

Have you noticed how the pricing has broken down to the downside? That suggests there are more forex traders who want to go short than those who want to go long!
They pushed the price lower to break the trend line, implying that a decline is likely.
The price movement after the breakout is roughly the same magnitude as the height of the formation, just like the other forex trading chart patterns we examined earlier.
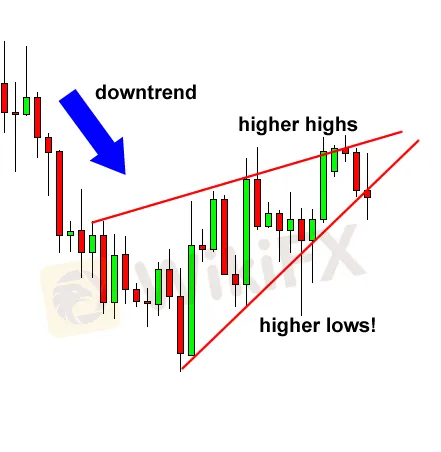
Let's look at another example of a rising wedge formation now. This time, though, it functions as a bearish continuation indication.

As can be seen, the price began in a decline before consolidating and drawing higher highs and even higher lows.

The price broke to the downside in this scenario, and the decline proceeded. It's called a continuation signal for a reason, man!
Have you noticed how the price has made a lovely downward move that is the same height as the wedge?
What have we learned about Japanese candlestick chart patterns so far?
A rising wedge that forms after an uptrend usually leads to a REVERSAL (downtrend), whereas a rising wedge that forms during a downtrend usually leads to CONTINUATION (downtrend).
Simply defined, a rising wedge is a negative chart pattern since it leads to a decline.
Wedge that is falling
The falling wedge, like the rising wedge, can be a reversal or continuation indication.
It is produced at the bottom of a downtrend as a reversal indicator, signaling that an uptrend will follow.
It is created during an uptrend as a continuation indicator, signaling that the upward price action would resume. The falling wedge, unlike the rising wedge, is a bullish chart pattern.

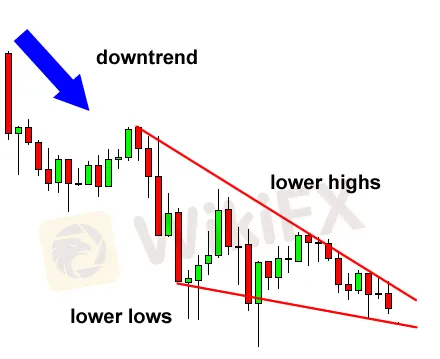
The collapsing wedge acts as a reversal indication in this case. The price made lower highs and lower lows after a downtrend.
The trend line connecting the highs and lows is steeper than the trend line connecting the highs and lows.

The pair made a nice move upwards after breaking over the top of the wedge, roughly equivalent to the height of the formation. The price surge in this case went a few more pips beyond that target!
Consider an example in which the falling wedge is used as a continuation indication.
As previously stated, the formation of a falling wedge during an upswing usually indicates that the trend will return later.

After a big surge, the price in this case consolidated for a while. This could indicate that buyers simply took a breather before recruiting additional people to join the bull camp.
Hmm, the pair appears to be gearing up for a big move. Which way would you prefer it to go?

See how the price climbed higher after breaking to the upper side?
We could have jumped in on the strong uptrend and captured some pips if we had set an entry order above the falling trend line connecting the pair's highs.
The height of the wedge formation would be a potential upside goal.
If you want to chase more pips, you can lock in some profits at the target by closing a piece of your position and leaving the remainder ride.
Disclaimer:
The views in this article only represent the author's personal views, and do not constitute investment advice on this platform. This platform does not guarantee the accuracy, completeness and timeliness of the information in the article, and will not be liable for any loss caused by the use of or reliance on the information in the article.
Read more

Forex is a game that I enjoy playing
These champions have one thing in common: they not only work their butts off, but they also enjoy what they do.

Wait patiently. Maintain your discipline
"Patience is the key to everything," American comic Arnold H. Glasgow once quipped. The chicken is gotten by hatching the egg rather than crushing it."

There isn't a Holy Grail to be found!
Ask any Wall Street quant (the highly nerdy math and physics PhDs who build complicated algorithmic trading techniques) why there isn't a "holy grail" indicator, approach, or system that generates revenues on a regular basis.

Concentrate on the Process. Profits aren't a priority
We've designed the School of WikiFX as simple and enjoyable as possible to help you learn and comprehend the fundamental tools and best practices used by forex traders all over the world, but keep in mind that a tool or strategy is only as good as the person who uses it.
WikiFX Broker
Latest News
What is a Stop Out Level?
Challenges of A-Book Execution
Japanese Candlestick Anatomy
What is the difference between support and resistance?
Candlesticks with Support and Resistance
Dual Candlestick Patterns
Basic Japanese Candlestick Patterns
How to Place Your Stop Using Fibonacci to Lose Less Money
What is the Difference Between Double Tops and Double Bottoms?
Bearish and Bullish Pennants and How to Trade Them
Currency Calculator


