简体中文
繁體中文
English
Pусский
日本語
ภาษาไทย
Tiếng Việt
Bahasa Indonesia
Español
हिन्दी
Filippiiniläinen
Français
Deutsch
Português
Türkçe
한국어
العربية
US Dollar Index Price Analysis: Weekly rising wedge keeps DXY bears hopeful near 95.50
Abstract:DXY fades corrective pullback from three-week low, consolidates biggest daily gains in a fortnight.

Bearish chart pattern, steady RSI favor sellers to aim for further downside.
61.8% Fibonacci retracement, 200-SMA adds to the upside filters.
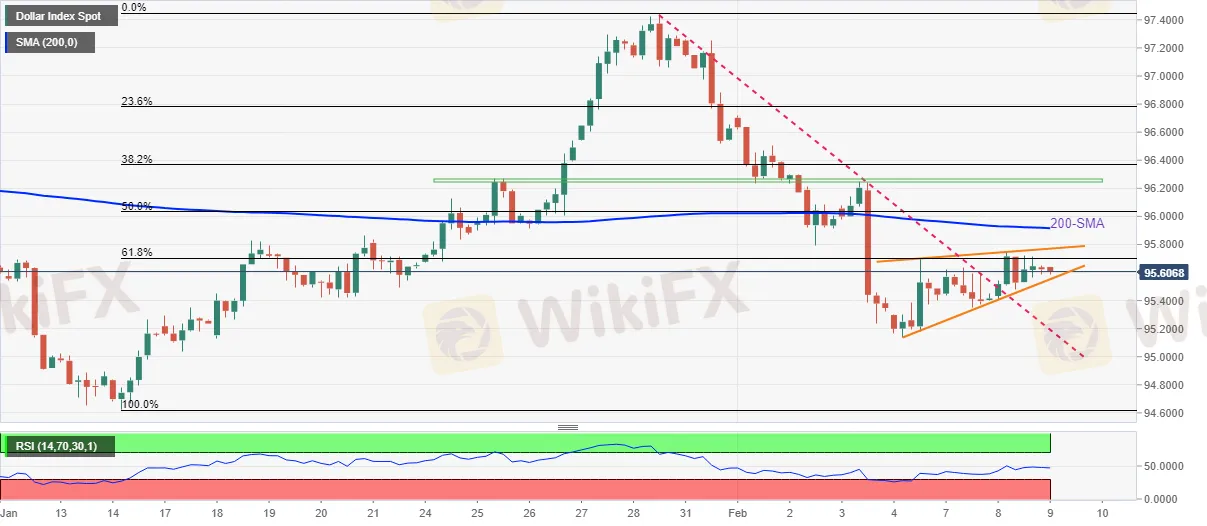
US Dollar Index (DXY) refreshes intraday low around 95.60 while paring the previous day‘s gains inside a rising wedge bearish chart pattern amid Wednesday’s Asian session.
That said, steady RSI and sustained trading below the 200-SMA also keep DXY bears hopeful.
However, a clear downside break of the stated wedges support line, near 95.55 at the latest, becomes necessary for the sellers to tighten grips.
Following that, the previous resistance line from late January, near 95.20, may offer an intermediate halt during the fall targeting the last months bottom surrounding 94.60.
Meanwhile, the corrective pullback may initially attack 61.8% Fibonacci retracement of January‘s upside near 95.70 before challenging the wedge’s resistance line near 95.80.
Also challenging short-term DXY upside is the 200-SMA level of 95.91, a break of which will recall bulls targeting a horizontal area from January 25, near 96.25.

Disclaimer:
The views in this article only represent the author's personal views, and do not constitute investment advice on this platform. This platform does not guarantee the accuracy, completeness and timeliness of the information in the article, and will not be liable for any loss caused by the use of or reliance on the information in the article.
Read more

WikiEXPO 2025 is set to embark on a new global tour
WikiEXPO 2025 is set to embark on a new global tour First station - Hong Kong! Are you ready?

Will the Euro and US Dollar Reach Parity in 2025?
Euro-dollar parity sparks debate again as 2025 approaches, with multiple factors shaping the exchange rate outlook.

US Dollar Surge Dominates Forex Market
The global forex market continues to show volatility, with the U.S. dollar fluctuating last week but overall maintaining a strong upward trend. How long can this momentum last?

Oil Prices Soar for 5 Days: How Long Will It Last?
Last week, the global oil market saw a strong performance, with Brent crude and WTI crude prices rising by 2.4% and around 5% respectively. Oil prices have now posted five consecutive days of gains. But how long can this rally last?
WikiFX Broker
Latest News
Wolf Capital Exposed: The $9.4M Crypto Ponzi Scheme that Lured Thousands with False Promises
Confirmed! US December non-farm payroll exceeded expectations
Spain plans 100% tax for homes bought by non-EU residents
90 Days, Rs.1800 Cr. Saved! MHA Reveals
The Yuan’s Struggle: How China Plans to Protect Its Economy
LiteForex Celebrates Its 20th Anniversary with a $1,000,000 Challenge
Misleading Bond Sales Practices: BMO Capital Markets Fined Again by SEC
Italy’s Largest Bank Intesa Sanpaolo Enters Cryptocurrency Market
What Every Trader Must Know in a Turbulent Market
400 Foreign Nationals Arrested in Crypto Scam Raid in Manila
Currency Calculator


