简体中文
繁體中文
English
Pусский
日本語
ภาษาไทย
Tiếng Việt
Bahasa Indonesia
Español
हिन्दी
Filippiiniläinen
Français
Deutsch
Português
Türkçe
한국어
العربية
USD/JPY Price Forecast
Abstract:Investors are still speculating that the Fed will ultimately start rolling back its massive pandemic-era stimulus later this year. This is due to a positive intraday move in US Treasury bond yields, which acted as a tailwind for the US dollar and limited any meaningful gains for the USD/JPY currency pair.
Investors are still speculating that the Fed will ultimately start rolling back its massive pandemic-era stimulus later this year. This is due to a positive intraday move in US Treasury bond yields, which acted as a tailwind for the US dollar and limited any meaningful gains for the USD/JPY currency pair.

USD/JPY Price Forecast – Technical Levels
Daily Support and Resistance
S3 109.49
S2 109.69
S1 109.8
Pivot Point 109.9
R1 110.01
R2 110.1
R3 110.31
USD/JPY Price Forecast – Upward Trendline Set To Breakout At 109.700
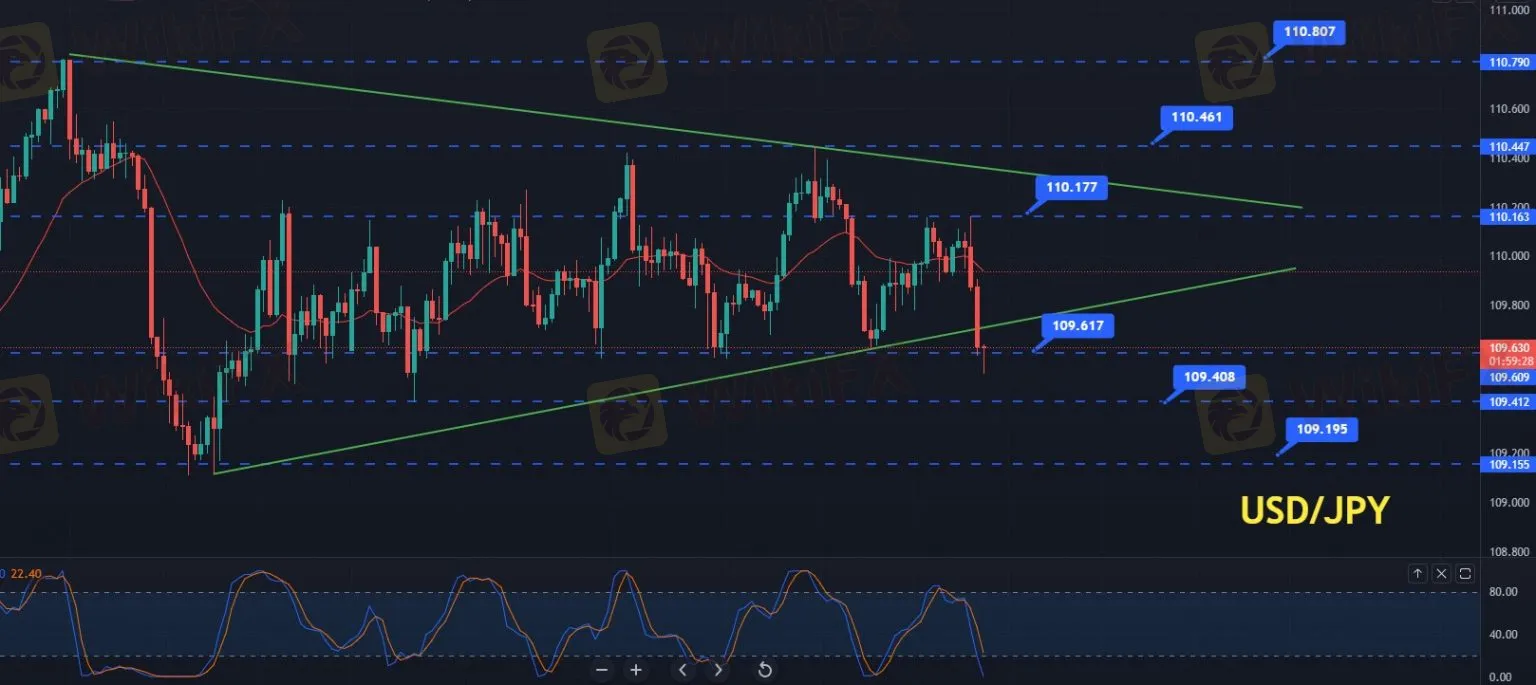
The USD/JPY currency pair is trading with a strong bearish bias at the 109.637 level. The USD/JPY is likely to find immediate support at the 109.408 level on the bearish side. Furthermore, the breakout of the 109.408 level is expected to expose USD/JPY prices towards the next support level of 109.195.
On the 4 hour timeframe, the pair has formed a bearish engulfing candle which suggests robust selling bias in the USD/JPY pair. Alongside, the 50 Peters exponential moving average provides a strong resistance at the 110.050 level.
Currently, the pair is trading at the 109.617 level, which is also working as a triple bottom level for the currency pair. However, the breakout of the 19.617 level can expose a strong selling bias until 109.408 and 109.120. On the bullish side, the Japanese yen may find strong resistance at the 110.050 level. A bullish breakout of this particular level can extend another round of buying until the 110.170 level.
Additionally, the Japanese yen may find strong resistance at the 110.461 level upon the breakout of the 110.177 level. Finally, leading technical indicators such as the stochastic RSI are indicating a sell. Therefore, Forex trading participants are likely to go for sell trades below the 110.050 level today.

Disclaimer:
The views in this article only represent the author's personal views, and do not constitute investment advice on this platform. This platform does not guarantee the accuracy, completeness and timeliness of the information in the article, and will not be liable for any loss caused by the use of or reliance on the information in the article.
WikiFX Broker
Latest News
Ghana Trader Jailed for $300K Forex and Crypto Scam
US Dollar Surge Dominates Forex Market
Hong Kong Police Bust Deepfake Crypto Scam Syndicate Involving $34 Million
Is it a good time to buy Korean Won with the current depreciation?
XRP Price Prediction for 2025: Will It Hit $4.30 or More?
Exnova Scam Alert: Account Blocked, Funds Stolen, and Zero Accountability
T3 Financial Crime Unit Freezes $100M in USDT
BlackRock Bitcoin ETF Outflows Hit $332M in Single Day
Terra Founder Do Kwon Denies Fraud Allegations in U.S. Court
Dr. Sandip Ghosh, Ex-RG Kar Principal, Involved in Multi-Crore Scam
Currency Calculator


