简体中文
繁體中文
English
Pусский
日本語
ภาษาไทย
Tiếng Việt
Bahasa Indonesia
Español
हिन्दी
Filippiiniläinen
Français
Deutsch
Português
Türkçe
한국어
العربية
Canadian Dollar Analysis, Tough Road Ahead? USD/CAD, AUD/CAD, NZD/CAD, GBP/CAD
Abstract:CANADIAN DOLLAR, USD/CAD, AUD/CAD, NZD/CAD, GBP/CAD – TECHNICAL ANALYSIS
Canadian Dollar seems at risk to some of its major peers
USD/CAD ready to resume rise as AUD/CAD looks lower?
NZD/CAD and GBP/CAD trend may favor the upside

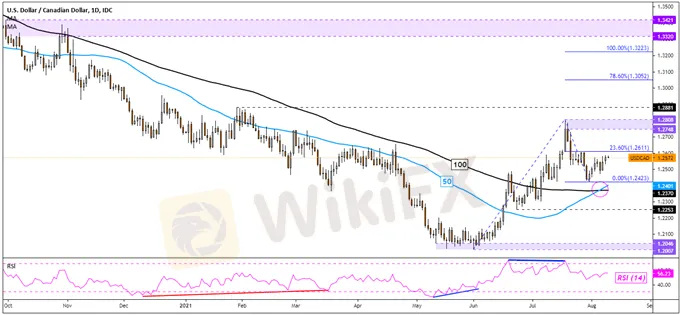
The Canadian Dollar may be vulnerable against the US Dollar after USD/CAD formed a ‘Golden Cross’ between the 50- and 100-day Simple Moving Averages (SMAs). The pair was initially on its way lower after establishing the 1.2748 – 1.2808 resistance zone, but support seemed to be established at 1.2423. Resuming Junes bottom could see the pair revisit the current 2021 peak at 1.2881. Otherwise, falling under the SMAs may open the door to aiming back at lows from earlier this year.

The Canadian Dollar could be setting up to resume its advance against the Australian Dollar since AUD/CAD topped in February. While the pair formed a Bullish Engulfing in early August, a combination of the 0.9248 – 0.9294 inflection zone and the ceiling of a falling channel pointed the cross back lower. Resuming this years top entails clearing 0.9146, exposing the 61.8% Fibonacci extension at 0.9104. In the event of a breakout above the channel, keep a close eye on the 100-day SMA. It could still reinstate the focus to the downside.

The Canadian Dollar could still be at risk to the New Zealand Dollar. While NZD/CAD‘s momentum above a bullish Falling Wedge has somewhat faded, a ’Golden Cross between the 50- and 100-day SMAs may form in the coming days. That could reinforce the dominant narrative to the upside. Shooting past the 38.2% Fibonacci retracement level at 0.8879 exposes the 0.8980 – 0.9011 inflection zone. On the other hand, clearing under the SMAs may open the door to retesting the 0.8577 – 0.8631 support zone.

The Canadian Dollar also remains vulnerable to the British Pound. GBP/CAD has continued to make upside progress after the pair breached a falling trendline from earlier this year. Granted, recent progress has been slow. A ‘Golden Cross’ recently formed between the 50- and 100-day SMAs, opening the door to a broader upside technical bias. That may see the pair push towards the April high. Negative RSI divergence does show that upside momentum is fading, which can at times precede a turn lower.

Disclaimer:
The views in this article only represent the author's personal views, and do not constitute investment advice on this platform. This platform does not guarantee the accuracy, completeness and timeliness of the information in the article, and will not be liable for any loss caused by the use of or reliance on the information in the article.
Read more

Weekly Fundamental Gold Price Forecast: Hawkish Central Banks a Hurdle
WEEKLY FUNDAMENTAL GOLD PRICE FORECAST: NEUTRAL

Gold Prices at Risk, Eyeing the Fed’s Key Inflation Gauge. Will XAU/USD Clear Support?
GOLD, XAU/USD, TREASURY YIELDS, CORE PCE, TECHNICAL ANALYSIS - TALKING POINTS:

British Pound (GBP) Price Outlook: EUR/GBP Downside Risk as ECB Meets
EUR/GBP PRICE, NEWS AND ANALYSIS:

Dollar Up, Yen Down as Investors Focus on Central Bank Policy Decisions
The dollar was up on Thursday morning in Asia, with the yen and euro on a downward trend ahead of central bank policy decisions in Japan and Europe.
WikiFX Broker
Latest News
AIMS Broker Review
The Hidden Checklist: Five Unconventional Steps to Vet Your Broker
YAMARKETS' Jingle Bells Christmas Offer!
Why is there so much exposure against PrimeX Capital?
Russia to Fully Ban Crypto Mining in 10 Regions Starting January 1, 2025
Two Californians Indicted for $22 Million Crypto and NFT Fraud
WikiFX Review: Is Ultima Markets Legit?
Colorado Duo Accused of $8M Investment Fraud Scheme
MTrading’s 2025 "Welcome Bonus" is Here
Malaysia Pioneers Zakat Payments with Cryptocurrencies
Currency Calculator


