简体中文
繁體中文
English
Pусский
日本語
ภาษาไทย
Tiếng Việt
Bahasa Indonesia
Español
हिन्दी
Filippiiniläinen
Français
Deutsch
Português
Türkçe
한국어
العربية
Dollar and Dow Mark Massive Breaks, But Are There Trends Post-FOMC?
Abstract:Dollar, Dow Jones, USDCAD, EURUSD and GBPUSD Talking Points:
The FOMC announced after their two-day meeting that its members had shifted forward their timeframe for rate hikes but stayed away from a clear taper
The Dollar enjoyed the biggest response to the top event risk with the biggest single-day rally since May 2020 while the Dow Index notched a bearish channel break
While there are high profile technical breaks in place, follow through requires a shift in market conditions which may beyond the Feds capacity to influence

As far as the path the Federal Reserve ultimately took this past session when it announced the outcome of its two-day policy meeting, there were few significant surprises. There was no change in the benchmark rate nor the tempo of the asset purchases the bank buys on a monthly basis. The change in messaging and forecast that was the crux of the shift didn‘t even stray from the standard list of options. Nevertheless, risk assets lead by US indices took a dive after the initial announcement and the US Dollar charged with its biggest single day rally in 13 months to finally clear out crushing congestion with a bearish bias behind it. There was overt volatility and tempting technical breaks sparked by a key event risk. Collectively it looks like a recipe for significant movement. However, I am of the belief that market conditions precede other analytical influences. Was such a nuanced update from even the world’s largest policy group enough to override the steady flag in liquidity across the financial system these past months? Its possible, but it is certainly worth keeping a deep sense of skepticism and close scrutiny when our views are fighting the tide.
Chart of DXY Dollar Index with 20 and 50-DMAs, 1-Day Rate of Change (Daily)

Looking back over the Federal Open Market Committee‘s (FOMC) policy decision, it would absolutely conform to expectations by keeping the benchmark rate range at 0.00 to 0.25 percent and maintaining a massive clip of $120 billion in asset purchases per month. It was the less assuming aspects of the event that proved more market moving. In the Summary of Economic Projections (SEP), the group raised growth and inflation forecasts along with interest rate assumptions in step. The time table to rate hikes is the foundation of speculation for the Dollar and risk watchers. In the timeline, the rate hike is the last move in the policy reversal preceded by the end of asset purchases (QE) which is heralded by the first reduction in purchases that will slowly wind down. Chairman Powell took pains to temper expectations of an imminent start to taper and said the conversation was a ’talking about talking about meeting‘. That is Fed-speak for ’we are not prepared to announce a taper just yet. That is likely to come in the next few months either with an official Fed meeting (July or September) or the Jackson Hole Symposium in August.
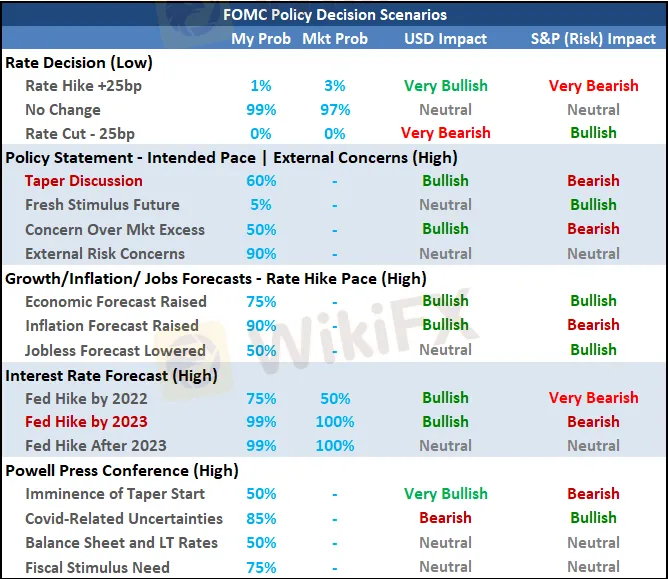
Table of FOMC Scenarios

The big news out of the policy meeting is the sharp upgrade in hawkish expectations from the Fed. Back in the last SEP (March 17th), only four members expected a rate hike by next year and a mere seven in 2023. That changed to seven anticipating a hike next year and 13 projecting a move by 2023, and the average actually pricing in two hikes through that year. That is unmistakably more hawkish than what we had seen previously. And, if that last step sees a shift forward in timing, the first step in the process (announcing the taper) would theoretically move up as well.
FOMC ‘Dot Plot’ with Member Forecasts for Interest Rates

Looking across the financial markets, most things with a risk-lean that were actively trading during the FOMC announcement shifted toward ‘risk off’. All of the major US indices were under pressure, but I would point out the Dow as been more consequential in its technical developments. The ‘value index’ slipped its post-pandemic, bull trend support as well as the 50-day moving average. That is a provocative development, but a break is not indicative of a trend with follow through. Volume did pick up on the day and the VIX volatility index picked up, but neither has yet to signal that a full deleveraging trend is imminent. There is potential here, but a mere moderation in extremes (record highs on index, tail risk premium, etc) does not have to lead to a full blown trend. The central bank has bought time until it will be expected to update on its policy again whether through its own intent or pressure from exogenous factors.
Chart of the Dow Jones Industrial Average Overlaid with 20 and 50-DMA and SKEW (Daily)

Considering that risk trends flipped negative and the Dollar caught a bid, it is worth assessing which of these moves were stronger and perhaps which can carry further without additional tail winds to keep momentum developing. I am particularly fond of USDJPY for this assessment given that both the Greenback and Yen are treated as safe havens in risk aversion, but the latter is more sensitive. Further, the Dollar can find its own appeal through its relative yield potential in a forward looking capacity. The Yen crosses did drop this past session, but USDJPY very clearly charged higher. As impressive as that was, there is much heavier technical resistance still overhead in the 111 and 111.50 area. Those are important hurdles to gauge conviction.
Chart of the USDJPY with 100-Day Moving Average (Daily)

THE DOLLAR PAIRS TO WATCH
While there is no doubt as to the strength of the Dollar just since the Fed decision, there is every reason in market conditions to question follow through. As such, Im much more interested in crosses with a technical picture that is closer to a range trade scenario rather than an open field break that then needs to shift its dependency to conviction. USDCAD is one such pair that is traversing an established congestion. The descending trend channel from the past 13 months is still in play, but we have simply covered much of the recent stretch since the BOC announced its taper a few months ago. Keep tabs on the Canadian data due later today.
Chart USDCAD with 50 and 100-DMAs and 30-Day Historical Range and ATR (Daily)

A pair with a lot of fundamental hang up typically, EURUSD has a broader range to consider. It is immediately testing support in the 200-day moving average and a ‘pivot level’ around 1.2000, but there is still further range to cover is the Dollar can keep a moderate sense of bullish interest to its back all the way down to 1.1700.
Chart of EURUSD with 200-Day Moving Average (Daily)

GBPUSD on the other hand has the sense of drama to its chart. We have seemingly cleared the more-than-month-long congestion that formed a head-and-shoulders pattern just shy of the midpoint to the 2014-2020 range at 1.4300. That reversal pattern has subsequently slipped 1.4000 which also happens to be within the same vicinity of the 100-day moving average. This looks like an effort to turn a much larger reversal. As enticing as that may seem, assess your beliefs on conviction and momentum in these market conditions. Can we actually track out the potential that many would read in this chart alone?
Chart of GBPUSD with 100-Day Moving Average and COT Net Spec Futures Positioning (Daily)

Stay tuned on WikiFX, more news coming soon!


Disclaimer:
The views in this article only represent the author's personal views, and do not constitute investment advice on this platform. This platform does not guarantee the accuracy, completeness and timeliness of the information in the article, and will not be liable for any loss caused by the use of or reliance on the information in the article.
Read more

Weekly Fundamental Gold Price Forecast: Hawkish Central Banks a Hurdle
WEEKLY FUNDAMENTAL GOLD PRICE FORECAST: NEUTRAL

Gold Prices at Risk, Eyeing the Fed’s Key Inflation Gauge. Will XAU/USD Clear Support?
GOLD, XAU/USD, TREASURY YIELDS, CORE PCE, TECHNICAL ANALYSIS - TALKING POINTS:

British Pound (GBP) Price Outlook: EUR/GBP Downside Risk as ECB Meets
EUR/GBP PRICE, NEWS AND ANALYSIS:

Dollar Up, Yen Down as Investors Focus on Central Bank Policy Decisions
The dollar was up on Thursday morning in Asia, with the yen and euro on a downward trend ahead of central bank policy decisions in Japan and Europe.
WikiFX Broker
Latest News
Spotware Unveils cTrader Store, Global Marketplace for Algo Creators
Elderly Trader Loses RM2.1M in WhatsApp Forex Scam
Gigamax Scam: Tracking Key Suspects in RM7 Million Crypto Fraud
CFI Partners with MI Cape Town, Cricket Team
Doo Financial Expands Reach with Indonesian Regulatory Licenses
WikiFX Review: Is IQ Option trustworthy?
Quadcode Markets: Trustworthy or Risky?
5 Questions to Ask Yourself Before Taking a Trade
Avoid Fake Websites of CPT Markets
Webull Canada Expands Options Trading to TFSAs and RRSPs
Currency Calculator


