简体中文
繁體中文
English
Pусский
日本語
ภาษาไทย
Tiếng Việt
Bahasa Indonesia
Español
हिन्दी
Filippiiniläinen
Français
Deutsch
Português
Türkçe
한국어
العربية
Gold Price Forecast: Gold Threatens Break, Bulls Nearing Control
Abstract:- Gold prices have been in a bearish channel almost nine months now, following an aggressively bullish trend. - Gold set its high on August 7th, and at the time Bitcoin was trading below $12k and Ethereum below $400. Have the anti-dollar tides changed for good, or was this a mere respite in the longer-term bullish backdrop for Gold? - The analysis contained in article relies on price action and chart formations.
Its been a long eight months for Gold bulls but over the next month, their wait may (or may not) be validated.
After an incredible surge through last summer that saw Gold prices move to an all-time-high, prices began to pullback in early-August and thats pretty much continued since. Over that span of time, investor focus for similar plays have moved into cryptocurrencies, creating wild topside trends that have even seemed to re-define the anti-Dollar trade for many.
Case in point, on the day that Gold prices topped, August 7th of last year, Bitcoin prices were still below $12,000. Ethereum, which is currently trading at over $3,000 per coin, was trading below $400 back then. And Dogecoin wasn‘t even trading at half a cent yet, whereas today, it’s threatening a breach of the 40 cent level. So quite a bit has changed since Gold prices have hit that all-time-high, and this has led many to believe that those flows that traditionally wouldve driven Gold prices higher have now been directed towards cryptocurrencies or other similar markets.
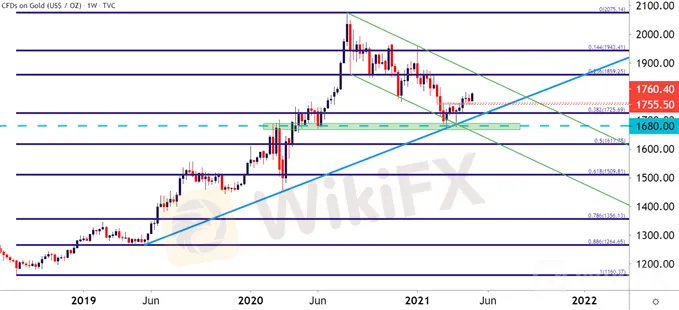
But taking a step back on Gold and theres still a bullish argument, particularly from the longer-term vantage point. Gold prices had become massively overbought when that high was getting set last August, and initially it looked as though that trend may be prone to more of a pullback than a full-on reversal.
At this stage, 38.2% of that prior trend was taken out and buyers have so far spent the first month of Q2 trying to get back into the drivers seat. And that eight-month sell-off takes on the form of a bull flag formation, with a support assist by a bullish trendline found by connecting May 2019 and March 2020 swing lows.
GOLD PRICE WEEKLY CHART

GOLD BUILDS A DOUBLE BOTTOM
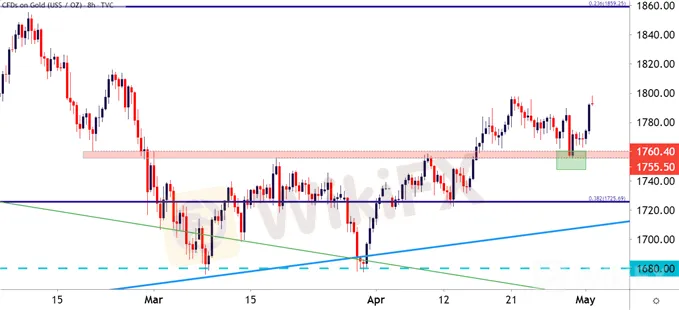
I had looked into this in early-April as Gold prices had built a possible double bottom formation, which is often followed with the aim of bullish reversals. Given the shorter-term dynamics, in which that longer-term bullish trend was being peeled back by sellers, a shorter-term reversal formation presented the potential for the longer-term trend to come back into order.
That theme has so far continued to build, with Gold prices breaking above the neckline of the double bottom formation in mid-April, and later in the month prices pulled back for a support test around prior resistance.
GOLD EIGHT-HOUR PRICE CHART

GOLD TICKS THE HIGH – CAN BULLS FORCE A BREAK
So technically Gold prices have already set a fresh two-month-high this morning, albeit barely touching above the high price from a couple of weeks ago. Sitting ahead is the 1800 psychological level which may be inducing some weakness as prices near a new high water mark after a strong stretch from support.
But probably the most notable item here is what didnt happen. On Friday the US Dollar put in an extremely strong move, erasing the Fed-fueled losses from Wednesday and finishing the week positive. Gold prices, however, remained above their own support. And when markets re-opened this week, the US Dollar went right back down and Gold prices surged up this fresh high.
So this is a possible positive for Gold bulls, and this keeps the look on the topside of Gold prices for now, looking for a test/breach of the 1800 psychological level. Beyond that, the 1816 level presents resistance potential, but the major spot appears to be around 1860, as theres a Fibonacci level lodged very near to a swing-high from February.
GOLD DAILY PRICE CHART

==========
WikiFX, a global leading broker inquiry platform!
Use WikiFX to get free trading strategies, scam alerts, and experts experience!
╔════════════════╗
Android : cutt.ly/Bkn0jKJ
iOS : cutt.ly/ekn0yOC
╚════════════════╝

Disclaimer:
The views in this article only represent the author's personal views, and do not constitute investment advice on this platform. This platform does not guarantee the accuracy, completeness and timeliness of the information in the article, and will not be liable for any loss caused by the use of or reliance on the information in the article.
Read more

Market Insights | January 15, 2024
U.S. stocks closed mixed. Dow Jones Industrial Average fell 118 points (-0.31%) to 37,592, S&P 500 gained 3 points (+0.08%) to 4,783, and Nasdaq 100 edged up 12 points (+0.07%) to 16,832.

Introducing Nutchaporn Chaowchuen (Tarn) - AUS Global's New Country Manager for Thailand
AUS Global appoints Ms. Nutchaporn Chaowchuen (Tarn) as Country Manager for Thailand. With expertise in trading and exceptional marketing skills, she is set to drive growth in the Thai market. Her victory in the Axi Psyquation 2019 competition underscores her trading prowess. Excited to lead, she vows to nurture partnerships and deliver top-notch services.

GEMFOREX - weekly analysis
Top 5 things to watch in markets in the week ahead

HFM Introduces New Virtual Analyst
The award-winning broker brings markets closer to its clients with the use of artificial intelligence (AI)
WikiFX Broker
Latest News
CFI Partners with MI Cape Town, Cricket Team
Doo Financial Expands Reach with Indonesian Regulatory Licenses
Volkswagen agrees deal to avoid Germany plant closures
Geopolitical Events: What They Are & Their Impact?
Webull Canada Expands Options Trading to TFSAs and RRSPs
CySEC Launches Redesigned Website Packed with New Features
WikiEXPO Global Expert Interview: Simone Martin—— Exploring Financial Regulation Change
TradingView Launches Liquidity Analysis Tool DEX Screener
MultiBank Group Wins Big at Traders Fair Hong Kong 2024
WikiFX Review: Is PU Prime a decent broker?
Currency Calculator


