简体中文
繁體中文
English
Pусский
日本語
ภาษาไทย
Tiếng Việt
Bahasa Indonesia
Español
हिन्दी
Filippiiniläinen
Français
Deutsch
Português
Türkçe
한국어
العربية
Gold Forecast: Has XAU/USD Price Action Officially Bottomed?
Abstract:GOLD PRICE OUTLOOK: XAU/USD PERKING UP AS REAL YIELDS WILT - Gold bulls push the precious metal to its highest level in eight-weeks - Gold outlook has improved largely thanks to a pullback in real yields - XAU/USD price action now challenges a key technical resistance zone
Gold Forecast: Has XAU/USD Price Action Officially Bottomed?GOLD PRICE OUTLOOK: XAU/USD PERKING UP AS REAL YIELDS WILT
· Gold bulls push the precious metal to its highest level in eight-weeks
· Gold outlook has improved largely thanks to a pullback in real yields
· XAU/USD price action now challenges a key technical resistance zone
Gold prices have been ripping higher recently since putting in a potential double-bottom pattern around $1,680/oz. In fact, the precious metal now trades at an eight-week high following a 7% climb off its 30 March swing low. A pullback in the US Dollar and real yields seem to be benefiting gold outlook and motivating the rebound being staged by XAU/USD price action.
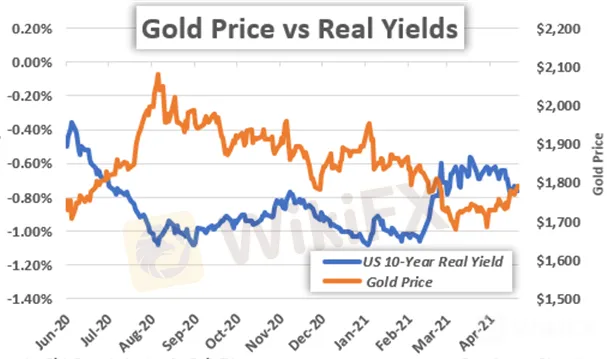
GOLD PRICE CHART WITH US TEN-YEAR REAL YIELD OVERLAID: DAILY TIME FRAME (02 JUNE 2020 TO 21 APRIL 2021)

As shown on the chart above, the price of gold tends to mirror (i.e. move in the opposite direction) of real yields. Due to this strong inverse relationship, the broader direction of real yields continues to stand out as one of the dominant fundamental catalysts weighing on gold prices. Correspondingly, if real yields struggle to regain upward momentum, there could be potential for XAU/USD to extend its rebound.
GOLD PRICE CHART: WEEKLY TIME FRAME (01 JULY 2019 TO 21 APRIL 2021)

Shifting focus to a technical perspective, how the precious metal finishes the week could prove quite telling of where gold prices trend next. A close above the 20-week simple moving average, which just so happens to underpin a big area of technical confluence around the $1,790-price level, might be followed by continuation higher and a bullish MACD crossover. The 38.2% Fibonacci retracement of its August 2020 to March 2021 trading range likely comes into focus under this scenario.
Surmounting this technical barrier has potential to motivate a larger rebound toward the upper descending trendline of golds eight-month long bull flag pattern. On the other hand, if gold bulls fail to maintain their upper hand and this technical barrier near the psychologically-significant $1,800-handle is rejected, the precious metal might recoil back toward its bottom Bollinger Band and year-to-date lows.
==========
WikiFX, a global leading broker inquiry platform!
Use WikiFX to get free trading strategies, scam alerts, and experts experience!
╔════════════════╗
Android : cutt.ly/Bkn0jKJ
iOS : cutt.ly/ekn0yOC
╚════════════════╝

Disclaimer:
The views in this article only represent the author's personal views, and do not constitute investment advice on this platform. This platform does not guarantee the accuracy, completeness and timeliness of the information in the article, and will not be liable for any loss caused by the use of or reliance on the information in the article.
Read more

Market Insights | January 15, 2024
U.S. stocks closed mixed. Dow Jones Industrial Average fell 118 points (-0.31%) to 37,592, S&P 500 gained 3 points (+0.08%) to 4,783, and Nasdaq 100 edged up 12 points (+0.07%) to 16,832.

Introducing Nutchaporn Chaowchuen (Tarn) - AUS Global's New Country Manager for Thailand
AUS Global appoints Ms. Nutchaporn Chaowchuen (Tarn) as Country Manager for Thailand. With expertise in trading and exceptional marketing skills, she is set to drive growth in the Thai market. Her victory in the Axi Psyquation 2019 competition underscores her trading prowess. Excited to lead, she vows to nurture partnerships and deliver top-notch services.

GEMFOREX - weekly analysis
Top 5 things to watch in markets in the week ahead

HFM Introduces New Virtual Analyst
The award-winning broker brings markets closer to its clients with the use of artificial intelligence (AI)
WikiFX Broker
Latest News
One article to understand the policy differences between Trump and Harris
Social Media Investment Scam Wipes Out RM450k Savings
FP Markets Received Three Major Awards
How Sentiment Analysis Powers Winning Forex Trades in 2024
Capital One Faces Potential CFPB Action Over Savings Account Disclosures
Malaysian Woman's RM80,000 Investment Dream Turns into a Nightmare
M2FXMarkets Review 2024: Read Before You Trade
FX SmartBull Review! Read first, then Invest
Bangladesh steps up payments to Adani Power to avoid supply cut
Bitcoin.com Introduces Venmo for U.S. Bitcoin Purchases via MoonPay
Currency Calculator


