简体中文
繁體中文
English
Pусский
日本語
ภาษาไทย
Tiếng Việt
Bahasa Indonesia
Español
हिन्दी
Filippiiniläinen
Français
Deutsch
Português
Türkçe
한국어
العربية
GBPUSD Price Commences Bullish Movement
Abstract:GBPUSD Price Commences Bullish Movement
-
GBPUSD Price Analysis – April 01
GBPUSD MarketKey levels:
GBPUSD Long-term trend: Bearish
GBPUSD Daily chart, April 01
GBPUSD Medium-term Trend: Bullish

When the Bulls increase their momentum and break up the dynamic resistance levels, then, $1.38 level will be tested, this may extend to $1.39 and $1.40 price levels. In case the dynamic resistance level prevent further increase in price, GBPUSD price may decrease towards the $1.37, $1.36 and $1.35Tlevels.
Resistance levels: $1.38, $1.39, $1.40
Support levels: $1.37, $1.36, $1.35
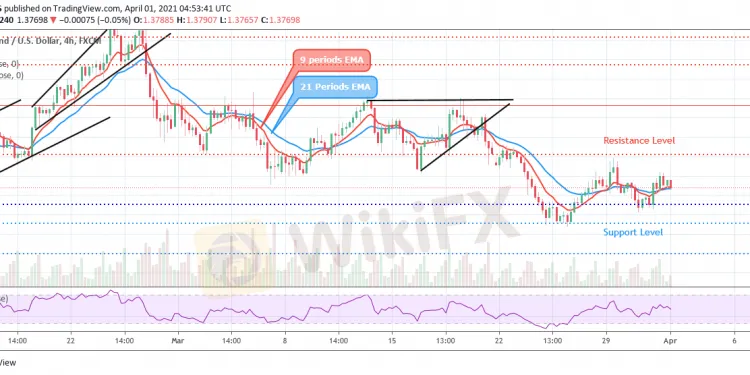
GBPUSD is bearish on the daily chart. The bearish momentum experienced last two weeks in the GBPUSD market bottomed the price at the support level of $1.36 on 24 March. The bulls defend the mentioned level with the formation of daily bullish candles. The price increases to break up $1.37 level. At the moment, GBPUSD is trying to penetrate the dynamic resistance levels.

The 21 periods EMA and 9 periods EMA are well separated with the pair trading below the two EMAs at close contact, which indicate a gradual increase in the bulls pressure. The relative strength index period 14 is at 40 levels with the signal lines parallel to the level which indicate low bullish and bearish momentum. When the Bulls increase their momentum and break up the dynamic resistance levels, then, $1.38 level will be tested, this may extend to $1.39 and $1.40 price levels. In case the dynamic resistance level prevent further increase in price, GBPUSD price may decrease towards the $1.37, $1.36 and $1.35Tlevels.
On the medium-term outlook, GBPUSD is on the bullish movement. The currency pair found support at $1.36, the price reverses and increase towards the resistance level of $1.38 after penetrating the $1.37 and the dynamic resistance level. The price retests the broken level of $1.37, the price is gradually increasing.

The price is trading above 9 periods EMA and the 21 periods EMA. The relative strength index period 14 is at 50 levels bending down which connotes sell signal which may be a pullback before bullish trend continues.
----------------
WikiFX, the world's No.1 broker inquiry platform!
Use WikiFX to get free trading strategies, scam alerts, and experts experience!
Android : cutt.ly/Bkn0jKJ
iOS : cutt.ly/ekn0yOC

Disclaimer:
The views in this article only represent the author's personal views, and do not constitute investment advice on this platform. This platform does not guarantee the accuracy, completeness and timeliness of the information in the article, and will not be liable for any loss caused by the use of or reliance on the information in the article.
Read more

Easy Trading Online Awarded “Best Forex Broker - Asia” at Wiki Finance EXPO 2024 Hong Kong
We are thrilled to announce that Easy Trading Online has been awarded the “Best Forex Broker - Asia” at the Wiki Finance EXPO 2024 Hong Kong! This prestigious recognition underscores our commitment to excellence and dedication to providing top-notch services to our clients.

Celebrating Excellence of Easy Trading Online at 2024 FastBull Awards Ceremony
On the evening of April 28, Easy Trading Online proudly received the 'Most Trusted Forex Broker' award at the BrokersView 2024, hosted by Fastbull. This accolade is a testament to our steadfast dedication to providing reliable and superior trading services in the forex and CFD brokerage industry.

Easy Trading Online Shines as Gold Sponsor at BrokersView Expo Dubai 2024
The BrokersView Expo Dubai 2024 is a premier event in the financial industry, bringing together top financial institutions, brokers, and technology providers from around the globe. As the Gold Sponsor of BrokersView Expo Dubai 2024, Easy Trading Online took the opportunity to showcase our latest products, service technologies, and core competitive advantages in the forex trading field.

Easy Trading Online at the Wiki Gala Night
On the 23rd of March, the Easy Trading Online family had the distinguished pleasure of being the Table Sponsor at the prestigious Wiki Gala Night. As we reflect on the event, it’s with a sense of pride and joy that we share the highlights and our takeaways from an evening that was as inspiring as it was splendid.
WikiFX Broker
Latest News
ASIC Sues Binance Australia Derivatives for Misclassifying Retail Clients
WikiFX Review: Is FxPro Reliable?
Malaysian-Thai Fraud Syndicate Dismantled, Millions in Losses Reported
Trading frauds topped the list of scams in India- Report Reveals
YAMARKETS' Jingle Bells Christmas Offer!
AIMS Broker Review
The Hidden Checklist: Five Unconventional Steps to Vet Your Broker
WikiFX Review: Something You Need to Know About Markets4you
Revolut Leads UK Neobanks in the Digital Banking Revolution
Fusion Markets: Safe Choice or Scam to Avoid?
Currency Calculator


