简体中文
繁體中文
English
Pусский
日本語
ภาษาไทย
Tiếng Việt
Bahasa Indonesia
Español
हिन्दी
Filippiiniläinen
Français
Deutsch
Português
Türkçe
한국어
العربية
Candle Sticks and The For ex market | Influencer‘s Insight •Bola Akinya
Abstract:Candle sticks are important tools in trading the Forex Market. A good Understanding of them allows traders to interpret possible market trends, price action and form decisions from those inferences.

Candle sticks are important tools in trading the Forex Market. A good Understanding of them allows traders to interpret possible market trends, price action and form decisions from those inferences.
There are various types of candlestick patterns which can signal bullish or bearish movements. This article will briefly touch upon what candlestick patterns are and introduce the top 5 formations all traders should know to trade the markets with ease and confidence.
A candlestick is a single bar which represents the price movement of a particular asset for a specific period. The information it displays includes the open, high, low and close for that time period.
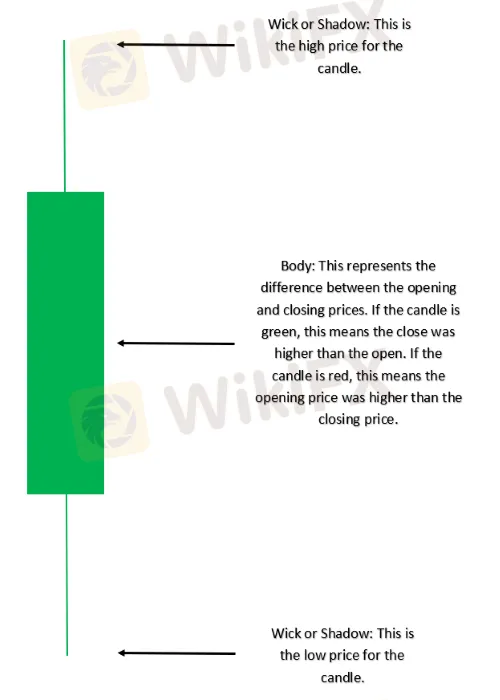
Candlestick patterns take into account one or more candlesticks to assist Traders/Speculators in developing inferences about future movements and price patterns of the underlying asset.
To Summarise, Candlesticks are graphical representation of price action.
CANDLESTICK PATTERNS CAN BE BULLISH OR BEARISH
To recognize and apply the most used candlestick patterns to a trading strategy, traders need to understand how the inclination of these patterns can affect the market direction (trend). The tables below summarize the two main categories of price movement that candlesticks can indicate. Many of these patterns are featured in my top 10 list below.
Bullish Candlestick Patterns:
| CANDLESTICK PATTERN | DIRECTION |
| Morning Star | Bullish (Reversal) |
| Bullish Engulfing | Bullish (Reversal) |
| Doji | Bullish/Bearish (Indecision) |
| Hammer | Bullish (Reversal) |
| Bullish Harami | Bullish (Reversal) |
| Piercing Pattern | Bullish (Reversal) |
| Inside Bars | Bullish (Continuation) |
| Long Wicks | Bullish/Bearish (Reversal) |
Bearish Candlestick Patterns:
| CANDLESTICK PATTERN | DIRECTION |
| Evening Star | Bearish (Reversal) |
| Bearish Engulfing | Bearish (Reversal) |
| Doji | Bearish/Bullish (Indecision) |
| Bearish Harami | Bearish (Reversal) |
| Dark Cloud Cover | Bearish (Reversal) |
| Inside Bars | Bearish/Bullish (Continuation) |
| Long Wicks | Bearish/Bullish (Reversal) |
| Shooting Star | Bearish (Reversal) |
TOP 10 CANDLESTICK PATTERNS TRADERS SHOULD KNOW
1 - EVENING STAR AND MORNING STAR
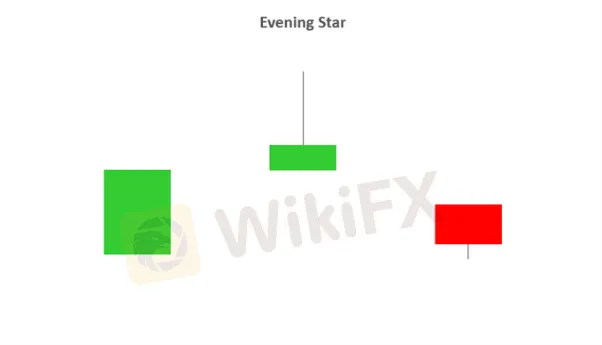
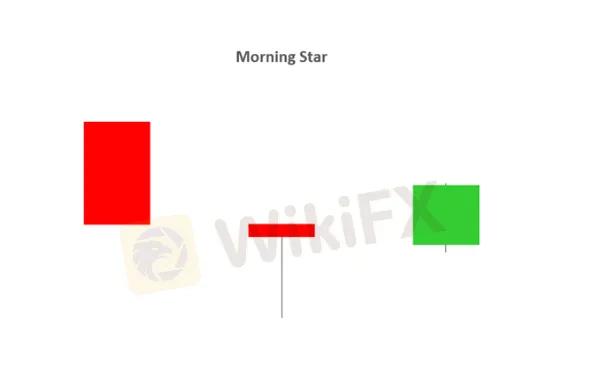
· The evening and morning star candlestick patterns occur at the end of upwards/downward trends respectively and tend to indicate reversal patterns.
· The names come from the star shaped formation of the arrangement.
· As you can see from the image below, the first candlestick is in the direction of the trend, followed by a bullish or bearish candle with a small body. The third candlestick is seen in the direction of the reversal, ideally closing passed the halfway point of the first candlestick.
· Trading this candlestick pattern will require a confirmation candle in the direction of the respective reversal – for example, traders will look for a bearish candle after the evening star.
2 - BULLISH & BEARISH ENGULFING
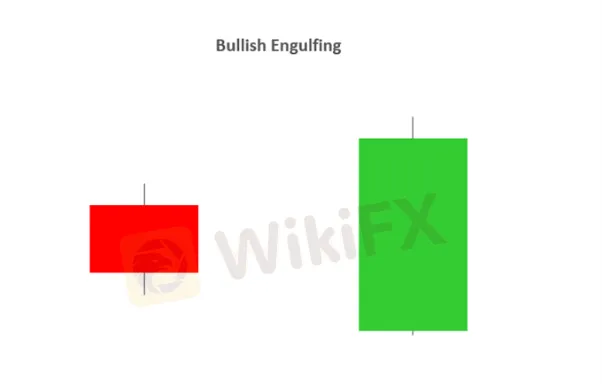
· A Bullish and bearish engulfing candlestick pattern may indicate reversal patterns.
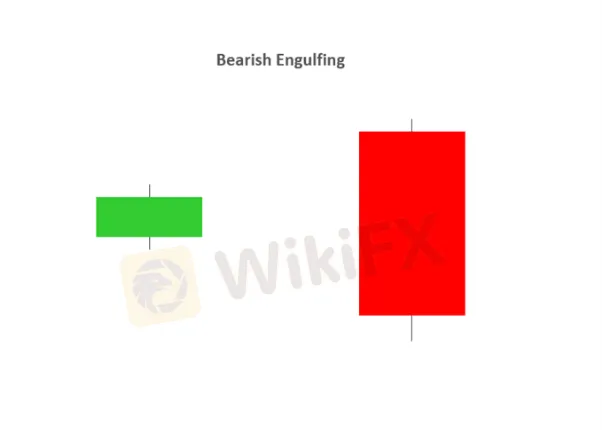
· A bullish engulfing candlestick formation shows bulls outweigh bears. As the pattern below shows, the green body (bulls) covers completely the first candlestick (bears).
· A bearish engulfing candlestick pattern is small green (or bullish) candle followed by a larger red (bearish) candle immersing the small green candle.
3 – DOJI
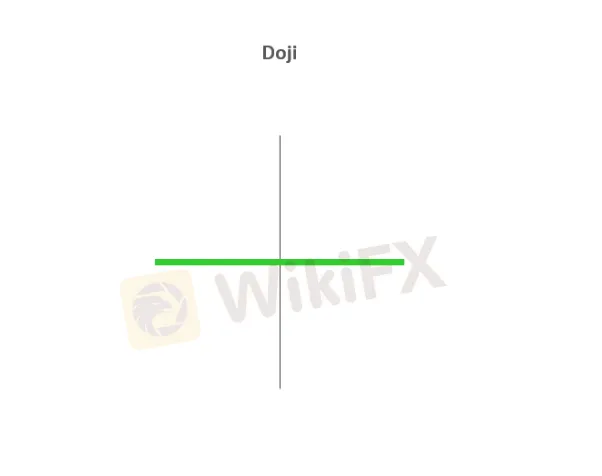
· The Doji candlestick chart pattern is associated with indecision in the market of the underlying asset. This could mean potential reversal of the current trend or consolidation.
· This pattern can occur at the top of an uptrend, bottom of a downtrend, or in the middle of a trend.
· The candlestick itself has an extremely small body centred between a long upper and lower wick.
4 – HAMMER
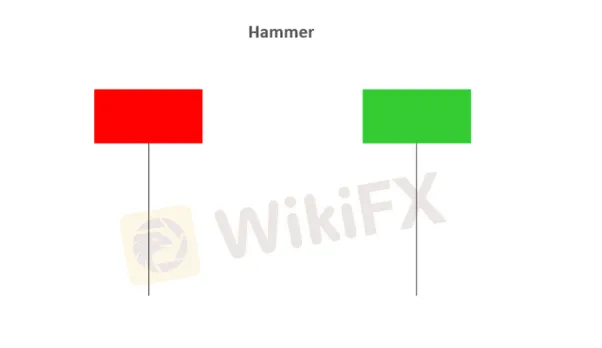
· The Hammer is viewed as a bullish reversal usually occurring at the bottom of a downward trend.
· This candle formation includes a small body whereby the open, high, low and close are roughly the same. There is a long lower wick beneath the body which should be more than twice the length of the candle body. The body may be bullish or bearish, however bullish is considered more favourable.
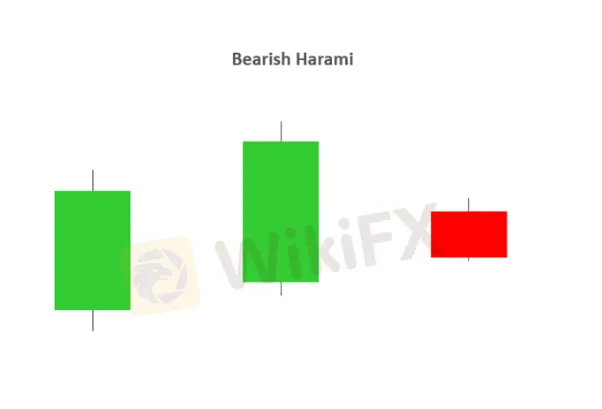
5 – BULLISH & BEARISH HARAMI
· A Bullish or Bearish Harami may indicate reversal patterns.
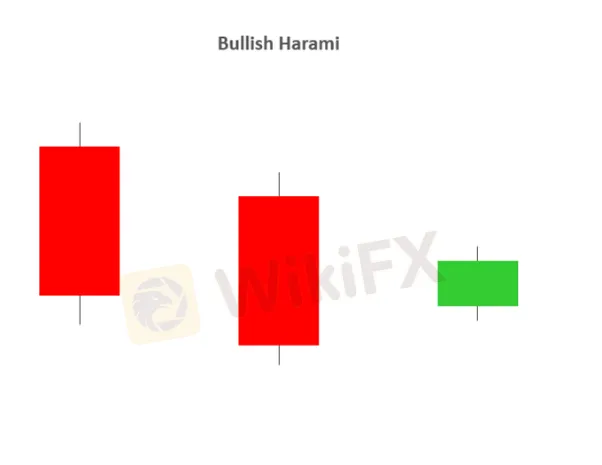
· The word “Harami” means “pregnant” in Japanese, and the name has been given to this candlestick pattern because it resembles a pregnant woman. The second candle in the pattern must be contained within the body of the first candle as seen in the images below. This holds true for both bullish and bearish Harami’s.
· A downtrend precedes a bullish Harami and an uptrend precedes that of a bearish Harami.
6 – DARK CLOUD COVER
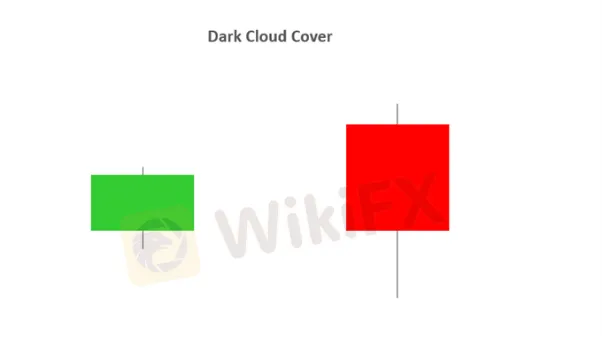
· The Dark Cloud Cover pattern is seen as a bearish reversal pattern.
· This candlestick pattern must occur during an uptrend. As seen in the image below, the bullish candle is followed by a bearish candle.
· This bearish candle must confirm certain criteria to validate the Dark Cloud Cover pattern:
1. The opening price must by higher than the previous days close.
2. The closing price must close below the midpoint of the previous bullish candle.
· The Dark Cloud Cover pattern looks similar to that of the Bearish Engulfing pattern. The difference between the two relates to the second candlestick. Bearish Engulfing pattern has the second candlestick opening above the close of the first, whilst the Dark Cloud Cover opens above the high of the first candle and closes below the midpoint of the first candlestick body.
7 – PIERCING PATTERN
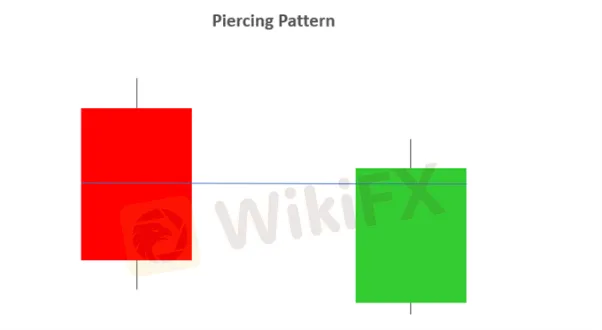
· The Piercing Pattern is viewed as a bullish candlestick reversal pattern, at the end of a downtrend or during a pullback within an uptrend, or at the support.
· There are two components of a Piercing Pattern formation:
1. Bearish candle
2. Bullish candle
· A Piercing Pattern occurs when a bullish candle (second) closes above the middle of bearish candle (first) in a downward trending market.
· The open price of the second candle should gap down at market open and ensue by closing above the mid-point of the previous candle as indicated below.
· Both the Piercing and Dark Cloud Cover patterns have similar characteristics. The difference is that the piercing line is a bullish reversal pattern as mentioned above, whilst the Dark Cloud Cover pattern is a bearish reversal pattern.
8 – INSIDE BARS
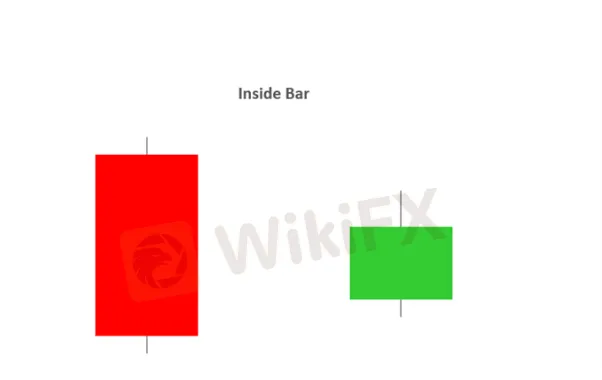
· The Inside Bar pattern is utilized in trending markets whereby the high and low of the Inside bar is within the parameters of the previous candle or “mother bar”.
· Inside Bars are traded within the direction of the trend – if the market is in a downtrend, the trader would look to continue with a short position with the presence of an Inside Bar. The same principal is applied in an uptrend.
· Trading in the direction of the trend is not always a given as key levels of support/resistance can indicate a reversal. Classically, the entry points for traders is positioned above or below the high or low of the mother bar depending on the direction of the trade.
· An inside bar is also similar to a bullish or a bearish harami candlestick pattern. The main difference being that with an inside bar, the highs and lows are considered while the real body is ignored.
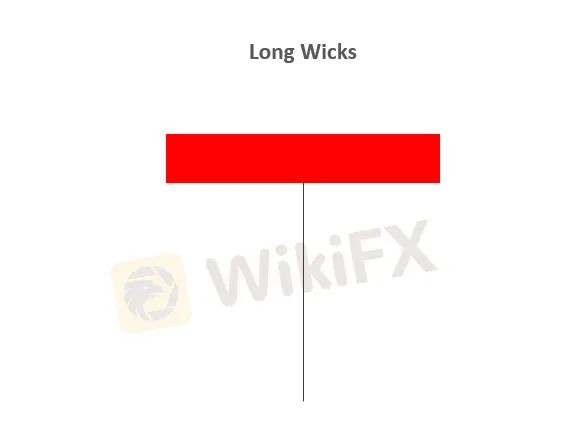
9 – LONG WICKS
· Long Wicks candlestick patterns often indicate a reversal in the trend.
· Long Wicks occur when prices are tested and then rejected. The wick indicates rejected prices.
· Identifying the trend is important to interpret the significance of the Long Wick.
· Identifying key levels and price action is often used in conjunction with Long Wick patterns.
10 – SHOOTING STAR
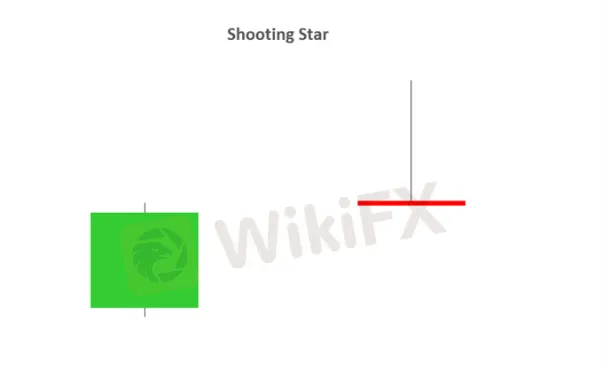
· A shooting star is a bearish candle with a long upper wick, little or no lower wick and a small real body near the day's low. It comes after an uptrend, and potentially indicates a trend reversal to the downside.
· The distance between the high and opening price of the candle must be more than twice as large as the Shooting Star's body. The distance between the lowest price for the day and the closing price must be small or non-existent.
Bola Akinya is a Forex trader and consultant with more than 20 years of immense experience in Forex Indices, Commodities and Currencies.
Prior to becoming a professional Trader, she held positions as a Head of Sales/Business Developer with Credit Registry and Operations Manager with Peak Merchant Bank both in Nigeria before moving to UK where she worked with great companies like AIG and The Wealth Training Company as Course Instructor and Speaker for over 15 years on the FX and Stock Markets before she started her own company – The Learn and Earn Forex Training Company over 5 years ago.
Over the years, she learned 121 from Top traders all over the UK which enabled her to develop her own unique strategies and trading systems that has made her a successful trader and Trainer.
She is married with 2 boys and 2 cats.
With the combined use of Fundamental and Technical analysis, she trades on the short term – medium term, as well as Economic News releases, combining both to give the consistency that is required for successful trades.
Disclaimer:
The views in this article only represent the author's personal views, and do not constitute investment advice on this platform. This platform does not guarantee the accuracy, completeness and timeliness of the information in the article, and will not be liable for any loss caused by the use of or reliance on the information in the article.
Read more

Key Forex Strategies
New to forex trading and looking for simple and effective trading strategies? We got you covered! In this quick guide, we'll explain some of the key forex strategies which are easy to digest. So, let's start!

Fundamental vs Technical Analysis
Fundamental and technical analysis play some of the most influential and critical roles in making trading decisions amongst traders today. They are widely accepted by stock, foreign exchange, indices and cryptocurrency traders worldwide. Traders use either or both of the methods to make key trading decisions in their respective markets.

Going Short of JPY Is Boosted by Yellen’s Remark on Interest-Rate Hikes Again
When interviewed by Bloomberg, Yellen, the U.S. Treasury Secretary, indicated that the USD 4-trillion budget released by Biden would be beneficial to America even if it may increase inflation and interest rates.

Brent oil is predicted of bullish repricing by Goldman Sach
According to Goldman Sachs' head of energy research, a nuclear deal between the U.S. and Iran could send energy prices higher - even if it means more supply in the oil markets. Talks are ongoing in Vienna between Iran and the six world powers - the U.S., China, Russia, France, U.K., and Germany - trying to salvage the 2015 landmark deal. Officials say there's been progress, but the conclusion of the negotiations remains unclear and oil prices have been soaring as a result.
WikiFX Broker
Latest News
Geopolitical Events: What They Are & Their Impact?
Top 10 Trading Indicators Every Forex Trader Should Know
Why Do You Feel Scared During Trade Execution?
Currency Calculator


