简体中文
繁體中文
English
Pусский
日本語
ภาษาไทย
Tiếng Việt
Bahasa Indonesia
Español
हिन्दी
Filippiiniläinen
Français
Deutsch
Português
Türkçe
한국어
العربية
15 Hottest Forex Strategies & Trading Patterns In 2021
Abstract:15 Hottest Forex Strategies & Trading Patterns In 2021

Are you using the wrong Forex trading strategy, or not using a Forex strategy at all which is also a strategy, just a really bad one?!?
Dont worry we have collected 15 most successful Forex Trading Strategies for beginners.
If you are not ready to use these trading strategies (especially if youre newbie trader), we recommend to try copy trading, which allows to enter the world of forex trading in a much easier way.
How to Choose The Best Forex Trading Strategy?
We have classify 4 best trading strategies and found the best forex patterns for each:
#1 Position trading – Holding positions for an extended period of time (months and years). This kind of forex trading is reserved for the ultra-patient traders, and requires a good eye to be able to spot the underlying long term trend.
This is the polar opposite of day trading as short term fluctuations are not taken into account when position trading.
Most popular position trading patterns:
-Inside Day Pattern
-Pullback Pattern
#2 Swing trading– A style of trading that keeps trades open from a couple of days to a few weeks. Swing traders primarily use technical and fundamental analysis to look for a profitable trade, and once a chunk of the price is captured, move on to the next one. A good eye for analyzing price trends and patterns. Suited for people who cant spend the whole day in front of the screen.
Most popular swing trading patterns:
-Head And Shoulders
-Support and Resistance
-Swing Trading Pattern
-The Outside Bar
-Double Top Pattern
#3 Scalping trading – Scalping is like those high action movies that keep you on the edge of your seat. Its fast paced, exciting, and mind-rattling all at once. Trades here are usually only held onto for a few seconds to a few minutes at the most!
What makes up for the small profits is the sheer number of trades opened and closed. A few pips here and there may add up to a significant amount in the end.
Since scalpers basically have to be glued to the charts, it is best suited for those who can spend several hours of undivided attention to their trading.
Most popular scalping patterns:
-1 min Forex News Trading Strategy
#4 Day trading – Typically only taking a few trades a day and closing them before the day is over. Day trading is suited for forex traders that have enough time throughout the day to analyze, execute and monitor a trade. Still requires more attention and analysis than swing or position trading but if you think scalping is too fast but swing trading is a bit slow for your taste, then day trading might be for you.
Most popular day trading patterns:
-The Double Red Pattern
-Pin Bar Pattern
-The Breakout Strategy
-Three Black Crows and Three White Soldiers
-The 2 Doji Candlesticks
-Double Bottom Pattern
-Double Inside Pattern
#1 HEAD AND SHOULDERS PATTERN TRADING STRATEGY
Time Frame: 4h/1 day
Currency Pairs: Any
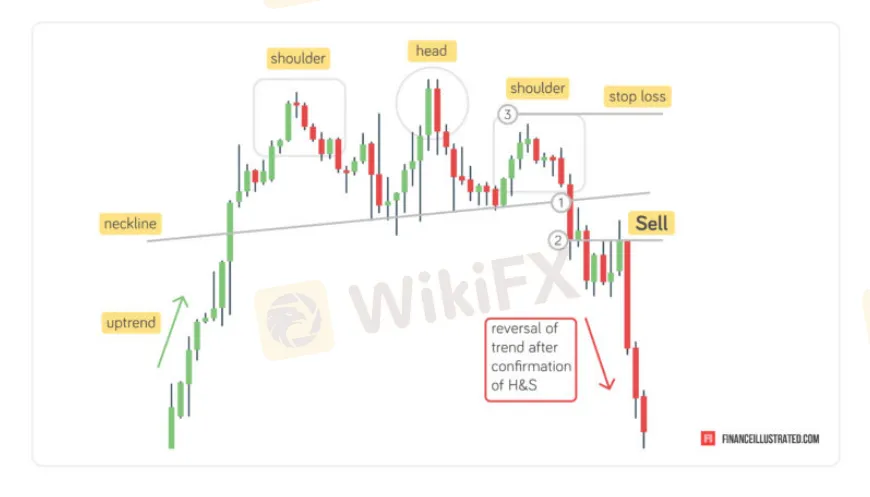
A head and shoulder pattern will in many instances occur on an uptrend.
Whenever this signal appears, it signifies that the uptrend momentum may have died, and a down trend is about to kick in. In simple words, it signifies that the price of a security that has been on the rise, may start falling.
It is formed whenever a lower peak (the first shoulder) – is followed by another higher peak (or the head), and then another lower peak (the second shoulder).
NOTE: The head should be the highest peak, while the shoulders on both sides of the head should be below the head.
If you then draw a line connecting the lowest points of the two troughs, you get a “neckline”. You will do well to remember that if the neckline is sloping downwards, the signal is interpreted as more reliable.
How To Profit From The Head And Shoulder Pattern?
You need to wait for the price to pierce below the neckline.
Place your SELL order at the close of the break out candle
Your stop loss should be a few pips (3-5 pips) above the right shoulder.
#2 THE PULLBACK PATTERN TRADING STRATEGY
Time Frame: 1h
Currency Pairs: Any
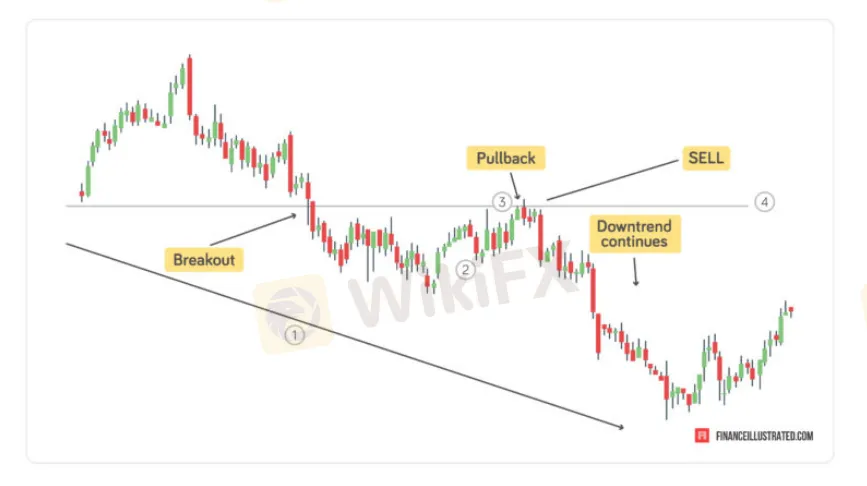
Pull back strategy in this case implies waiting for the market to retrace from the overall trend, and then jumping in. In simple words, you enter the market when there is a short term deviation from the dominant trend.
If the market is in an uptrend, it is very obvious that the market will not just keep going up.
At some point, the market will “pull back” before pushing up further. This present you as a trader with the perfect opportunity to join the trend.
You will do well to remember that this strategy can be applied on both uptrends and downtrends. In a down trend, simply wait for the market to bounce off a retracement, then jump in and ride the bearish trend.
How To Profit From The Pullbacks Pattern?
1. Identify a long term trend, in this case we have long term bearish trend.
2. Identify a pull back in the long term trend you just identified. A bullish move within the overall bearish market.
3. Wait for the price to pull back to a resistance or support level, and enter a sell order
4. Place your stop loss some few pips below/above the support/ resistance level
#3 1 MIN FOREX NEWS TRADING STRATEGY
Time Frame: 1min
Currency Pairs: we suggest EUR/USD, GBP/USD, USD/JPY, USD/CAD, AUD/USD
Whether you are a newbie, or even an experienced trader, am sure you know that economic news move currency prices, its also called fundamental analysis. Such economic news include the all time popular non-farm payroll, employment rates or even interest rates decision. But how can we tap the power of these economic news to our advantage?
The 1 min forex news strategy lets you do this.
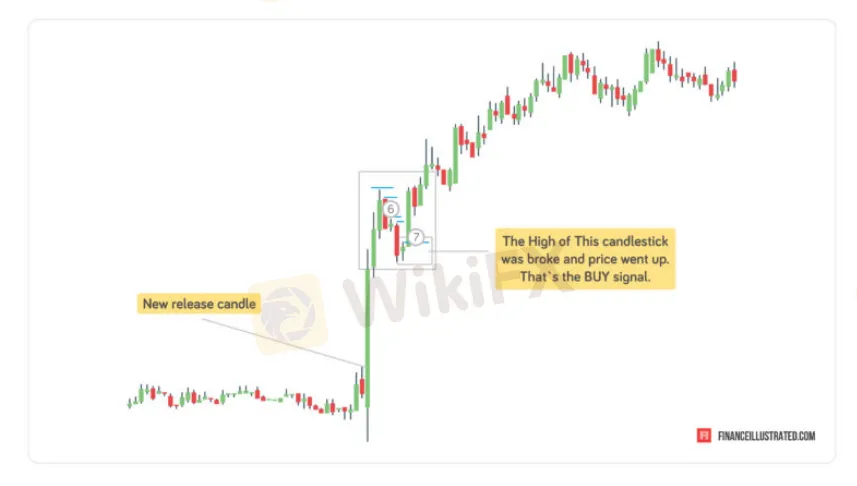
To trade this strategy, first wait for the announcement, check out the economic figures announced, wait for the initial reaction to die and then take action.
Lets say the Federal Reserve has raised interest rates from 2%-2.5%. With this strategy, you should wait for the initial reaction to die, and then enter your position.
How To Profit From The 1 Min Forex News Trading Strategy?
Identify news you want to trade, and then find out their scheduled time from your forex calendar. Use for example ForexFactory calendar.

Forex Factory Economic Calendar
After the news has been released, refresh your calendar to check out the released figures.
If the news are favourable for the base currency, price will obviously soar, and vice versa.
Turn to the 1 min time frame, and check out for the candlesticks highs and lows.
Assuming the news were favourable to the base currency, and the price is soaring up high making higher highs and higher lows.
Watch out for any retracements, in this case lower highs or lower lows.
Buy when a candlestick breaks the high of a previous candle
#4 The Inside Day Pattern Trading Strategy
Time Frame: 1day
Currency Pairs: any
The inside day is one of the most important chart patterns you need to familiarize yourself with. Even if you opt not to trade the pattern, it will help you uncover important clues in the market.
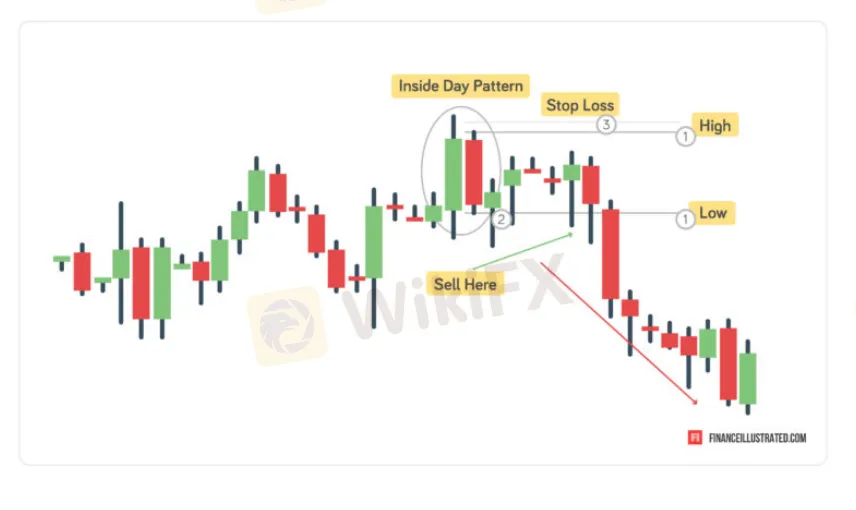
Inside day pattern is a two candle pattern where the second day candle is completely engulfed within the ranges of the previous day candle. In short, the highs and the lows of the second day candle are completely within the range of the previous candle. It signals a possible break out in the market. A break out is a sharp price movement in either direction; up or down.
An inside day clues of an eventual break out, but doesnt tell you the direction of the breakout.
How To Profit From The Inside Day Pattern?
Begin by marking the high and the low of the “inside day candle” i.e. the second candle.
If subsequent price actions break this range upwards, then buy. If it breaks the range downwards, then sell.
Place your stop loss a few pips above/ below the inside day. For a bearish market place above, for a bullish market, you will place below.
#5 SUPPORT AND RESISTANCE TRADING STRATEGY
Time Frame: 1h
Currency Pairs: Any
Support and Resistance is one of the most popular strategies you can use.
It's quite simple and its used to identify critical areas of the markets, including the market direction, and timing for entry, and exit positions.
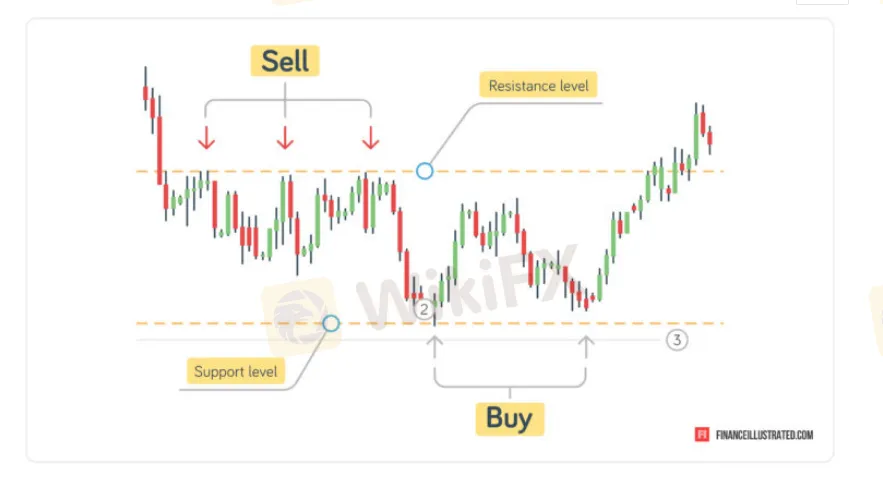
Support refers to the area on the price chart where prices have dropped, but then also struggling to break below. Resistance is that position on the price chart where prices have risen, but are struggling to break above. These positions are usually highlighted using angled or horizontal lines, known as trend lines.
How To Profit From The Support And Resistance Strategy?
Mark the significant support/resistance areas.
Wait for the price to reach this region, and as it bounces off, you take your position. So if it bounces off a resistance level, you sell. If it bounces off a support, you buy.
The stop loss should be placed below the support, or above the resistance level.
#6 THE DOUBLE RED PATTERN TRADING STRATEGY
Time Frame: 1h
Currency Pairs: Any
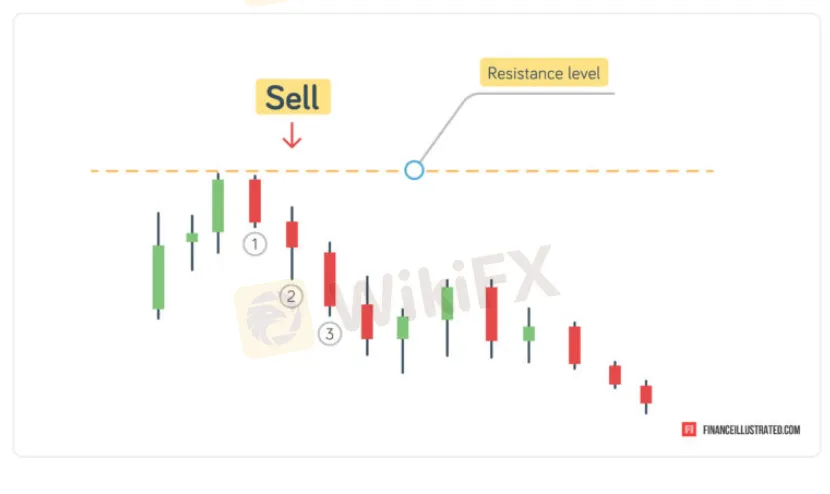
As the name suggests, this pattern is marked by two successive red candles. The second candle usually closes lower than the first candles bottom shadow. This implies that the prices came lower than the lower of the previous trade. It points to an imminent downward trend.
Its important to note that this pattern should not be used in a volatile market. Hence, its not suitable in the event of expected big news.
This is because any major news can be reason for disruption in market trends.
How To Profit From The Double Red Pattern?
Identify and pick an asset you would like to trade. Carefully watch the price movements on the price charts until you can recognize the first red bar. Then, patiently wait for the second red bar to form.
You can only confirm the pattern once the second red bar closes lower than the first red pattern.
Wait for a third red pattern to appear below the second red pattern, then you can execute your sell order.
#7 SWING TRADING PATTERN TRADING STRATEGY
Time Frame: 1 week
Currency Pairs: Any
A new trader can immensely benefit from the swing strategy. Its based on short term trading trends, allowing you to hold an asset just for a short time. The pattern relies on only taking small profits while cutting losses much quicker.
The rule of thumb is that, positions using this technique can be held within a few days to a couple of weeks. The time factor is quite crucial, with the average length being between 5 to 10 days. This allows for small gains, which eventually builds your portfolio.
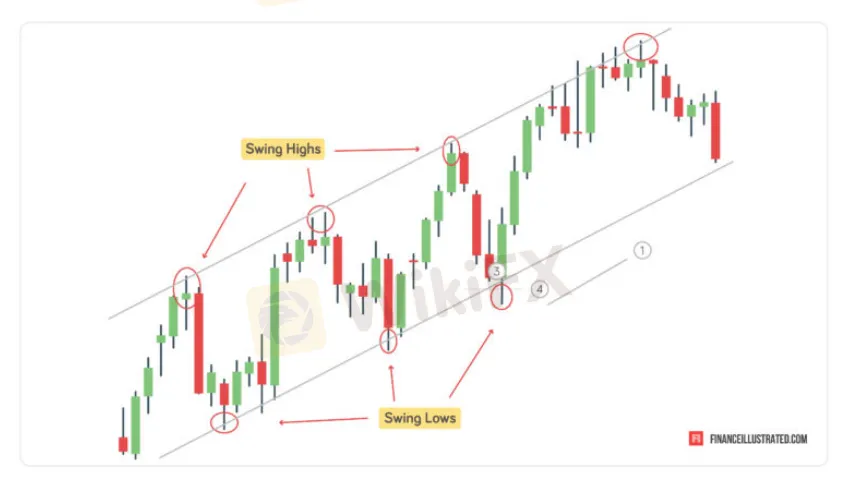
In short, when swing trading, one needs to identify swings within the trend and then take position.
How To Profit From The Swing Pattern?
Begin by identifying a trend that you want to take advantage of
Then as the market goes up, be on the lookout for swing lows
Buy during the swinglows incase its an uptrend. For a downtrend, sell during swing highs
Place your stop loss some few pips below the swing low for a buy position, and a few pips above for a sell order.
#8 PIN BAR STRATEGY/PINOCCHIO PATTERN TRADING STRATEGY
Time Frame: 1h, 4h
Currency Pairs: Any
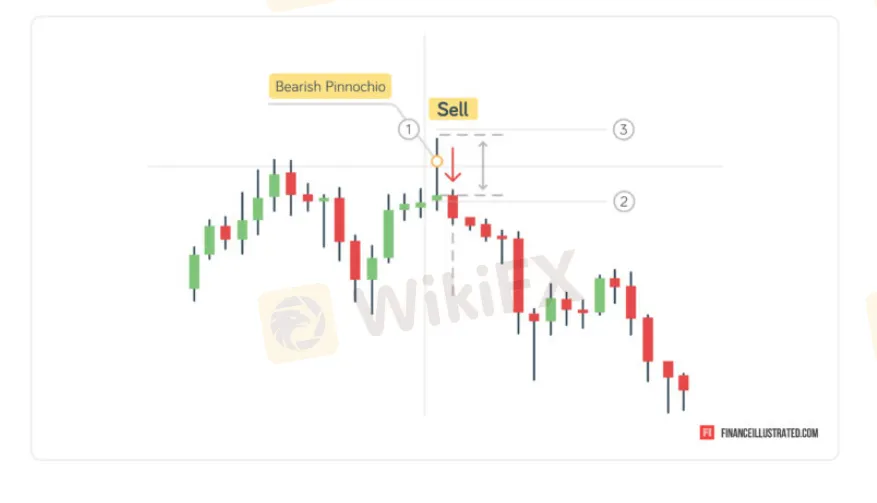
The pin bar strategy is a fundamental trading technique usually identified by a long shadow with a small real body. The pattern appears with a single price bar in the form of a candlestick, indicating a sharp reversal and price rejection.
The tail of the pin bar shows the area where there is price rejection.This suggests that the prices will continue moving in the opposite direction of the tail point.
The shadow should be at least twice the body, that is 1:2. And the longer the shadow compared to the body, the more effective the pattern.
How To Profit From The Pinbar Pattern?
Identify a pinocchio pattern occurring around key areas of support and resistance.
At the close of the candle, open a trade opposite to the direction of the shadow. Like in our case, the shadow is is bullish, so we open a sell position
Place your stop loss a few pips above or below the shadow.
#9 THE BREAKOUT PATTERN TRADING STRATEGY
Time Frame: 4h
Currency Pairs: Any
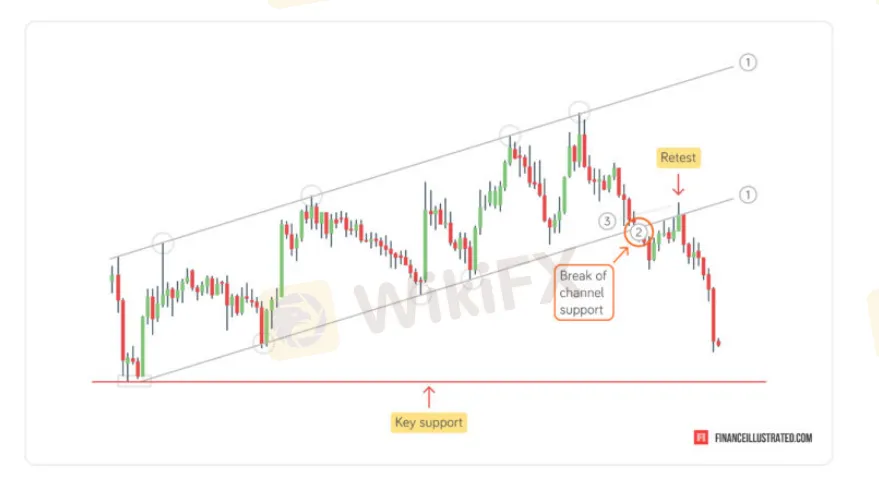
A break out is usually formed when prices trading in a certain price range breaks it, and trades below or above the range. It could also happen when prices break a certain level, be it a resistance, support, fibonacci or even pivot points.
The strategy is to enter the market as soon as the breakout happens, and only exit when the volatility dies.
How To Profit From The Breakout Pattern?
Identify a security trading within a range, like in the channel below.
Enter your sell position as soon as the price breaches the channel. In this case, its a sell as it breached the channel downwards. To be even safer, you can wait for a second candle to confirm a break out before taking your position in the direction of the break out.
Place Stop loss a few pips inside the channel.
#10 THE THREE BLACK CROWS PATTERN TRADING STRATEGY
Time Frame: 1 day
Currency Pairs: Any
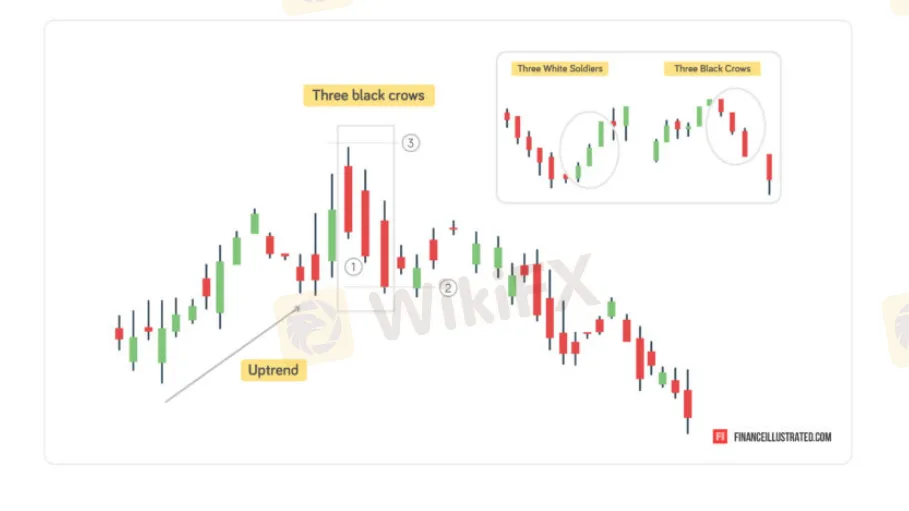
It features three bearish candlesticks after an uptrend.
Also, the second candle should close near its high, leaving a small upper shadow. Lastly, the third candle(soldier) should be at least the size of the second soldier.
The three black crows is a bullish pattern which you can use to predict a potential reversal in an existing uptrend.
Before trading this pattern, ensure that the second soldier has a larger body than the first soldier.
How To Profit From The Three Black Crows Pattern?
Identify a three black crows pattern on a bullish trend.
Place a sell order at the close of the third soldier
Place your stop loss just above the first crow
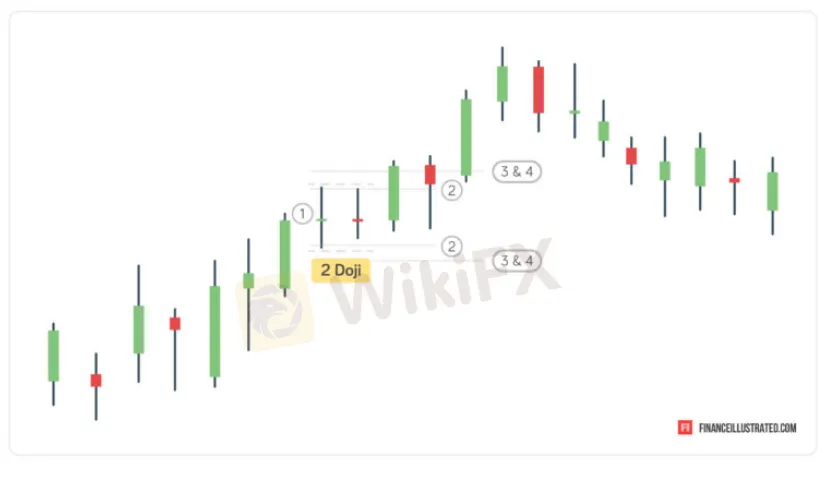
The formation is a signal of an up/down battle between the bears and the bulls.
And a break out in either direction may be imminent.
Identify two successive doji candlestick.
Mark the highs and the lows of the pattern.
Place a buy stop order a few pips above the pattern and a sell stop just below the border of the pattern.
Place a stop loss for the buy stop just below the lower border, and a stop loss for the buy stop just above the upper border.
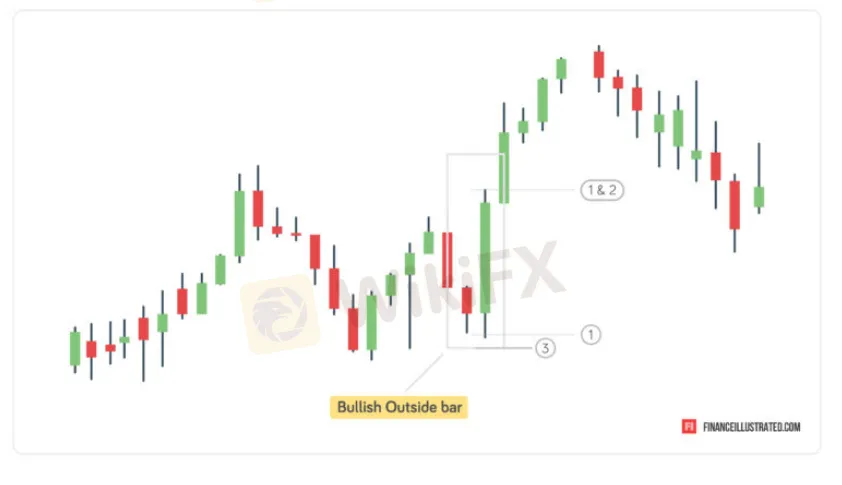
Mark the borders of the outside bar
Go long at the break of the outside bar
Stop loss should be placed a few pips above the high or low of the outside bar
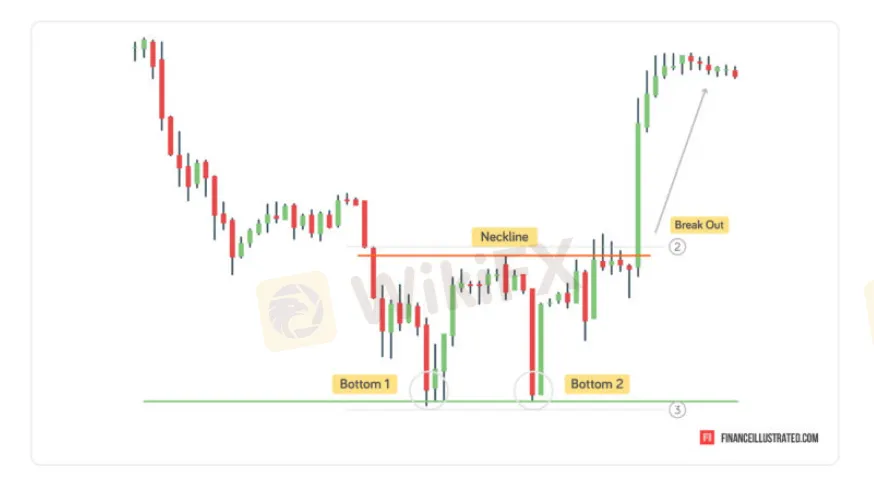
Identify a double bottom in a long term downtrend market
Place a buy stop order just above the neckline
Put your stop loss just below the second low of the double bottom
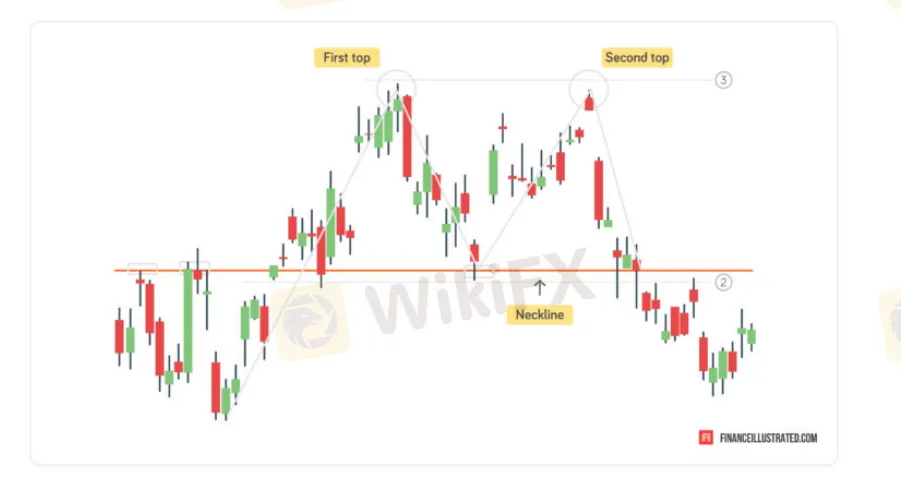
Identify a double top in a long term uptrend market
Place a sell stop order just below the neckline
Put your stop loss just above the second high of the double bottom
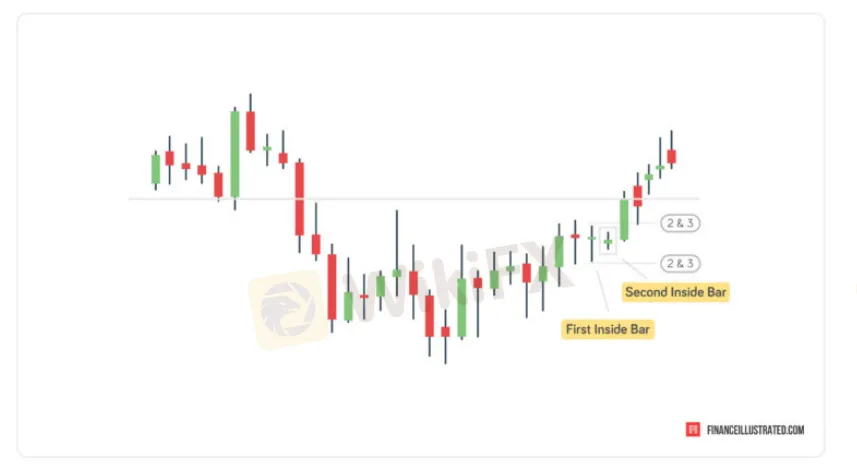
Identify the pattern in this case, two successive inside bars
Place a buy stop order just a few pips above the first inside bar, and a sell stop order a few pips below the first pin bar.
Your stop loss for the buy stop order should be placed a few pips below the first inside bar. The stop loss for sell stop order on the other hand should be placed a few pips above the first inside bar.
#11 THE 2 DOJI CANDLESTICKS FOREX BREAKOUT STRATEGY
Time Frame: 1h/4h
Currency Pairs: Any
This trading strategy is characterized by 2 successive Doji patterns, which usually provide the best risk to reward strategy for investors. Doji signs are + like candlesticks that signifies a form of indecision in the market.
How To Profit From The 2 Doji Candlesticks Pattern?
#12 THE OUTSIDE BAR PATTERN TRADING STRATEGY
Time Frame: 4h and daily
Currency Pairs: Any
An Outside Bar is a compelling reversal trading strategy whose current candle high and low engulfs the previous. You can implement this strategy to help in determining the bullish/ bearish reversal trends that could be about to take place in the market.
Its quite easy to recognize this formation on the charts, as both the high and lows of the previous candle are within the ranges of second candle. Remember, if this happens in a strong downtrend, then the probability of reversal is even higher.
How To Profit From The Outside Bar Pattern?
#13 THE DOUBLE BOTTOM CHART PATTERN TRADING STRATEGY
Time Frame: 1h/4h
Currency Pairs: Any
The Double Bottom is one of the most popular and simplest reversal patterns on the price charts. It will normally happen when the price tests a support area twice forming two bottoms. This pattern usually forms after a long stretch downwards, and which you can use to make long position.
How To Profit From The Double Bottom Pattern?
#14 THE DOUBLE TOP PATTERN TRADING STRATEGY
Time Frame: 1h/4h
Currency Pairs: Any
Double Top is a reversal trading pattern, which begins with a bullish trend. It consists of a price swing that occurs at the same level on the price chart.
Two tops mark this pattern, and after the formation of the second top, its evident that the price action may start to drop, moving into a bearish trend.
It is formed ones the bullish price reaches the same high point twice without breaking it.
How To Profit From The Double Tops?
#15 THE DOUBLE INSIDE BAR TRADING STRATEGY
Time Frame: 1h/4h
Currency Pairs: Any
The Double Inside Bar is a trend reversal pattern consisting of two inside bars, which usually form next to each other.
The second candlestick often forms inside the shadow of the previous inside bar, leading to an engulfing characteristic.
The most common cause of these formation is as a result of high volatility in the forex market. At this point, there is always high anticipation of a breakout towards an uptrend or downtrend.
How To Profit From The Double Inside Bar Pattern?
------------------
WikiFX, the world's No.1 broker inquiry platform!
Use WikiFX to get free trading strategies, scam alerts, and experts experience! https://bit.ly/2XhbYt5

Disclaimer:
The views in this article only represent the author's personal views, and do not constitute investment advice on this platform. This platform does not guarantee the accuracy, completeness and timeliness of the information in the article, and will not be liable for any loss caused by the use of or reliance on the information in the article.
Read more

Easy Trading Online Awarded “Best Forex Broker - Asia” at Wiki Finance EXPO 2024 Hong Kong
We are thrilled to announce that Easy Trading Online has been awarded the “Best Forex Broker - Asia” at the Wiki Finance EXPO 2024 Hong Kong! This prestigious recognition underscores our commitment to excellence and dedication to providing top-notch services to our clients.

Celebrating Excellence of Easy Trading Online at 2024 FastBull Awards Ceremony
On the evening of April 28, Easy Trading Online proudly received the 'Most Trusted Forex Broker' award at the BrokersView 2024, hosted by Fastbull. This accolade is a testament to our steadfast dedication to providing reliable and superior trading services in the forex and CFD brokerage industry.

Easy Trading Online Shines as Gold Sponsor at BrokersView Expo Dubai 2024
The BrokersView Expo Dubai 2024 is a premier event in the financial industry, bringing together top financial institutions, brokers, and technology providers from around the globe. As the Gold Sponsor of BrokersView Expo Dubai 2024, Easy Trading Online took the opportunity to showcase our latest products, service technologies, and core competitive advantages in the forex trading field.

Easy Trading Online at the Wiki Gala Night
On the 23rd of March, the Easy Trading Online family had the distinguished pleasure of being the Table Sponsor at the prestigious Wiki Gala Night. As we reflect on the event, it’s with a sense of pride and joy that we share the highlights and our takeaways from an evening that was as inspiring as it was splendid.
WikiFX Broker
Latest News
CFI Partners with MI Cape Town, Cricket Team
Doo Financial Expands Reach with Indonesian Regulatory Licenses
Volkswagen agrees deal to avoid Germany plant closures
Geopolitical Events: What They Are & Their Impact?
Webull Canada Expands Options Trading to TFSAs and RRSPs
CySEC Launches Redesigned Website Packed with New Features
WikiEXPO Global Expert Interview: Simone Martin—— Exploring Financial Regulation Change
TradingView Launches Liquidity Analysis Tool DEX Screener
MultiBank Group Wins Big at Traders Fair Hong Kong 2024
WikiFX Review: Is PU Prime a decent broker?
Currency Calculator


