简体中文
繁體中文
English
Pусский
日本語
ภาษาไทย
Tiếng Việt
Bahasa Indonesia
Español
हिन्दी
Filippiiniläinen
Français
Deutsch
Português
Türkçe
한국어
العربية
Rupee likely to trade in 73.90-74.90 range this week
Abstract:USD/INR traded with positive bias throughout the last trading week and appreciated by more than 60 paise on a week-on-week basis. The candle formed on November 9, 2020, with high upper and lower shadow generated demand at lower levels which was followed by three bullish candles in a row.
USD/INR traded with positive bias throughout the last trading week and appreciated by more than 60 paise on a week-on-week basis. The candle formed on November 9, 2020, with high upper and lower shadow generated demand at lower levels which was followed by three bullish candles in a row.
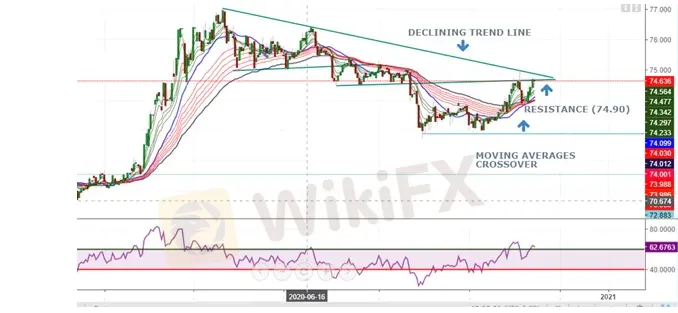
The downward trend of the currency pair seems to be getting abated but the road for bulls still looks skeptical and the range-bound move can be expected in the coming trading sessions. The bullish crossover of short term and medium term moving averages are likely to provide a cushion to the prices at lower levels while the short term negative divergence and overhead resistance of 74.70 could abate the up move for time being. Apart from this, the declining trend line originated by joining the highs of April 21, 2020, and June 18, 2020, could act as a supply point at 74.90 per USD. The base for the short term is emerging at 73.90 per USD and traders can expect the currency pair to trade in the range of 73.90 to 74.90 per USD in this trading week.
Considering the overall scenario, it is quite apparent that the currency pair is trading near a strong resistance zone and to trade the setup traders can deploy “bear call spread”.

Disclaimer:
The views in this article only represent the author's personal views, and do not constitute investment advice on this platform. This platform does not guarantee the accuracy, completeness and timeliness of the information in the article, and will not be liable for any loss caused by the use of or reliance on the information in the article.
WikiFX Broker
Latest News
CFI Partners with MI Cape Town, Cricket Team
Doo Financial Expands Reach with Indonesian Regulatory Licenses
Volkswagen agrees deal to avoid Germany plant closures
Geopolitical Events: What They Are & Their Impact?
Webull Canada Expands Options Trading to TFSAs and RRSPs
CySEC Launches Redesigned Website Packed with New Features
WikiEXPO Global Expert Interview: Simone Martin—— Exploring Financial Regulation Change
TradingView Launches Liquidity Analysis Tool DEX Screener
MultiBank Group Wins Big at Traders Fair Hong Kong 2024
WikiFX Review: Is PU Prime a decent broker?
Currency Calculator


